Churn Rate: What It Is and How to Calculate It
One starting group. One clear measure of loss.
On this page
Churn rate is the percentage of customers who leave a business during a defined period. It is especially useful for subscription and recurring-revenue businesses, but the same idea applies whenever a company needs to understand how quickly it is losing customers.
A churn rate turns customer losses into a comparable percentage. That makes it easier to track retention over time and notice when customer relationships are weakening.
What is churn rate?
Customer churn is the loss of customers over time. Churn rate expresses that loss as a percentage of the customers who were present at the start of a period.
Churn rate = Customers lost from the starting group during the period / Customers at the start of the period x 100
The period can be a month, quarter or year. What matters most is using the same definition consistently.

Visual reference. 192 of the original 200 remain: 96% retention under the same rule. New joiners do not erase customer loss or establish an ending active total. Invented counts, not a benchmark or diagnosis.
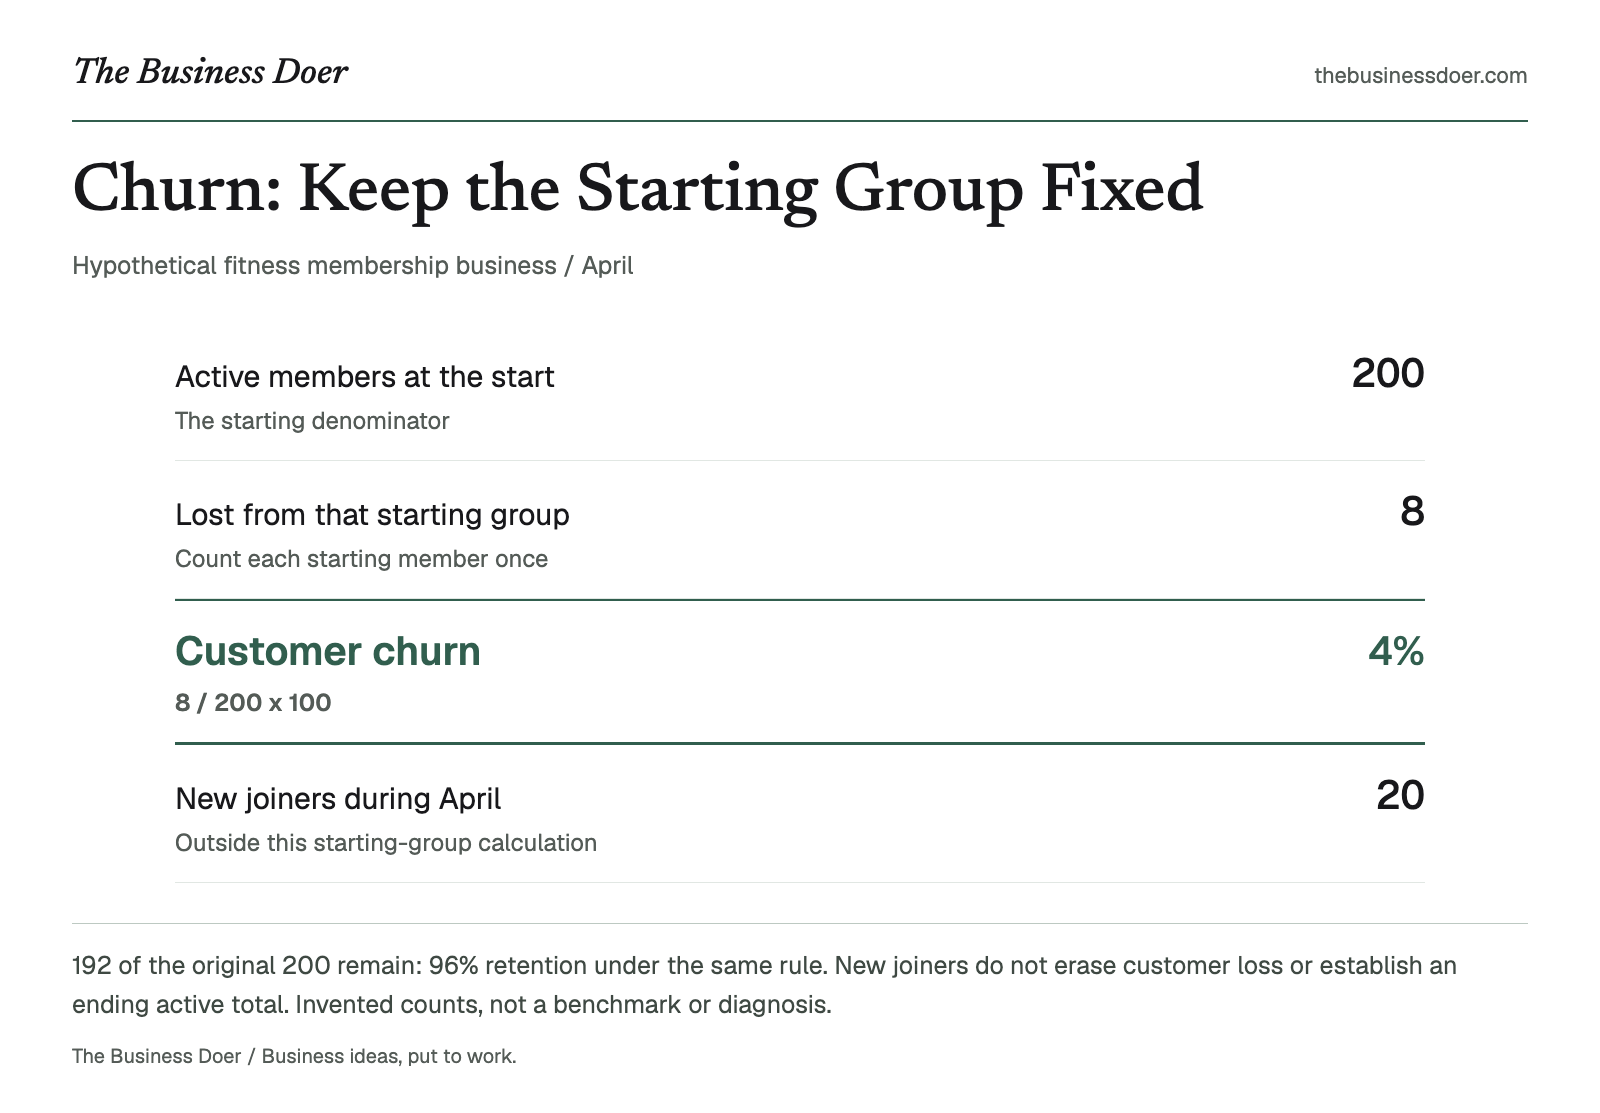
Text version
Hypothetical fitness membership business / April
- Active members at the start
- 200. The starting denominator
- Lost from that starting group
- 8. Count each starting member once
- Customer churn
- 4%. 8 / 200 x 100
- New joiners during April
- 20. Outside this starting-group calculation
Why does it matter?
A business can acquire new customers and still struggle to grow if existing customers keep leaving. Churn helps answer a simple question: How much of the customer base are we losing?
Tracking it can help a business spot whether customer relationships are becoming stronger or weaker. A sudden increase may point to problems with onboarding, service quality, pricing, product value, payment failures or the type of customers being acquired. These are possibilities to investigate, not causes established by the rate alone.
Churn can also affect revenue stability, customer lifetime value and the amount of new acquisition needed simply to replace lost customers. The AARRR Funnel puts retention into the wider customer lifecycle; unit economics connects customer relationships with acquisition and service costs.
The formula and how it works
The basic customer churn formula uses two numbers:
- Customers at the start of the period: the active customer base when measurement begins.
- Customers lost during the period: customers from that starting group who leave during the period.
Then calculate:
Churn rate = Customers lost / Starting customers x 100
New customers acquired during the period are not added to this starting denominator. Customers who both join and leave during the period are outside this particular starting-group calculation; track them separately rather than mixing cohorts. Count each starting customer at most once under the documented rule.
A business should also define what "lost" means. In a subscription service, it may mean a canceled or expired subscription. In another business, it may mean a customer who has not purchased again within a defined period. Document how pauses, reactivations and multiple subscriptions are treated, and keep the customer unit consistent.
A simple example
Hypothetical example: A small fitness membership business starts April with 200 active members.
During April:
- 8 of those members leave.
- 20 new members join.
The churn calculation uses the 200 members who were active at the start:
| Measure | April example | Treatment |
|---|---|---|
| Starting active members | 200 | Denominator |
| Members lost from that group | 8 | Numerator |
| New members during April | 20 | Outside the starting-group calculation |
| Customer churn rate | 4% | 8 / 200 x 100 |
The monthly customer churn rate is 4%. Under the same group and loss rule, 192 of the starting members remain: 96% retention.
The 20 new members matter for total customer growth, but they do not change this churn calculation. Their own subsequent losses or retention need separate tracking; new signups alone do not establish the ending active customer count.

A fitness membership studio gives the customer-loss example a concrete setting. This generated scene is illustrative, not a real business or evidence of membership counts, retention or reasons for leaving.
When should you use it?
Churn rate is most useful when customers have an ongoing relationship with the business. Common examples include subscriptions, memberships, software services, telecom services and recurring contracts.
It can also help compare:
- one period with another;
- different customer segments;
- different plans or pricing tiers; and
- customers acquired through different channels.
The comparison is useful only when the churn definition and time period stay consistent. The Ideal Customer Profile (ICP) can help define relevant groups, but observed customer outcomes must test the profile rather than merely confirm an assumption.
How to interpret the result
A lower churn rate means a smaller share of the starting customer base left during the period. A higher churn rate means a larger share left.
There is no universal "good" churn rate. Expected churn can differ by industry, contract length, customer type, price, billing frequency and business model. The most useful comparison is often against your own historical performance and against similar customer groups.
Common confusion
Churn rate vs retention rate
Churn measures customers lost. Retention measures customers kept.
For the same starting group, period and complementary loss/retention rule, retention rate = 100% - churn rate. Do not assume every reporting system uses this definition: activity-based retention, reactivations or different cohorts can produce a different calculation.
Customer churn vs revenue churn
Customer churn counts customers. Revenue churn measures recurring revenue lost from cancellations, downgrades or similar changes. Gross revenue churn excludes expansion; net revenue churn also accounts for expansion from existing customers.
A business can lose a small number of large customers and therefore have low customer churn but high revenue churn. Do not substitute one metric for the other.
Cancellation vs churn
A cancellation request does not always mean the customer has already churned. If a customer cancels today but remains active until the end of a paid term, define whether churn is recorded at cancellation or when access ends.
Common mistakes
- Changing the definition between periods. The metric is hard to compare if "churned customer" means something different each month.
- Using the wrong denominator. This calculation uses customers at the start of the period, not every customer who appeared during it.
- Mixing time periods. Monthly churn and annual churn are not directly interchangeable; do not simply multiply a monthly rate by 12.
- Treating all churn as the same. Voluntary cancellations and involuntary losses such as failed payments can have different causes.
- Assuming the number explains the cause. Churn tells you how much customer loss occurred, not why it occurred.
Limitations
Churn rate is a summary metric. It can reveal whether customer loss is increasing or decreasing, but it does not explain the reason. It can also hide differences between customer segments, so important groups may need to be reviewed separately.
A very small starting group can produce a large percentage change from one customer. Always retain the underlying counts. A zero starting group makes this rate undefined, not 0%.
Quick checklist
Put it to work: a 20-minute churn check
Choose the most recent completed month for a business with recurring customers.
- Minutes 0-4: Define the group and period. Write down the active customer count on the first day and exactly what counts as a churned customer.
- Minutes 4-9: Verify the losses. Count how many customers from that starting group met the loss rule during the month. Keep new joiners separate.
- Minutes 9-13: Calculate the rate. Divide losses by starting customers and multiply by 100. Retain both counts with the percentage.
- Minutes 13-17: Check a relevant segment. Repeat for one documented subset, such as a plan or acquisition channel, if enough data exists. Use the same period and loss rule.
- Minutes 17-20: Separate finding from explanation. Write one sentence describing the observed result and one question that needs further evidence to explain it.
Do not try to solve the churn problem in this exercise. The goal is only to define and calculate the metric correctly.
No result yet. Enter a positive starting group and valid losses. A zero starting group makes churn undefined, not 0%.
- Starting customers: Enter a whole customer count, without separators.
- Customers lost: Enter a whole customer count, without separators.
- Record the customer group.
- Record the measurement period.
- Record the customer-loss rule.
- Record the observed finding.
- Record the evidence question.
Key takeaways
- Churn rate measures the percentage of a starting customer base that leaves during a defined period.
- The calculation is customers lost from that group divided by starting customers, multiplied by 100.
- New customers are outside this calculation; they do not change the starting denominator.
- Customer churn and revenue churn measure different things.
- Churn detects customer loss but does not explain why customers leave.
Final takeaway
Churn rate measures the percentage of a starting customer base that leaves during a defined period. Its value comes from consistency: define the customer, the period and what counts as leaving, then use the same method over time.
The result will not tell you why customers leave, but it will show whether customer loss is becoming a bigger or smaller business problem.