Economies of Scale: What They Are and How They Lower Unit Costs
Lower cost per item. Not lower spending overall.
On this page
Economies of scale occur when operating at a larger scale lowers the average cost of producing each unit. In the long-run sense, the business can adjust its premises, equipment and staffing rather than simply make more with its existing setup.
The important word is average. A larger operation can spend more in total while producing each item for less.
What are economies of scale?
Economies of scale describe a cost advantage associated with producing more. They do not mean that every growing business becomes more efficient.
"Long run" means enough flexibility to change all production inputs; it is not a fixed number of years. Compare appropriately sized operations producing the same item, not a well-run factory with a poorly run one.

Visual reference. All figures are illustrative, not supplier quotes. The lower-output check assumes EUR 3.50 output-related cost still applies. Underutilization is not diseconomies of scale. Production costs exclude wider business expenses.
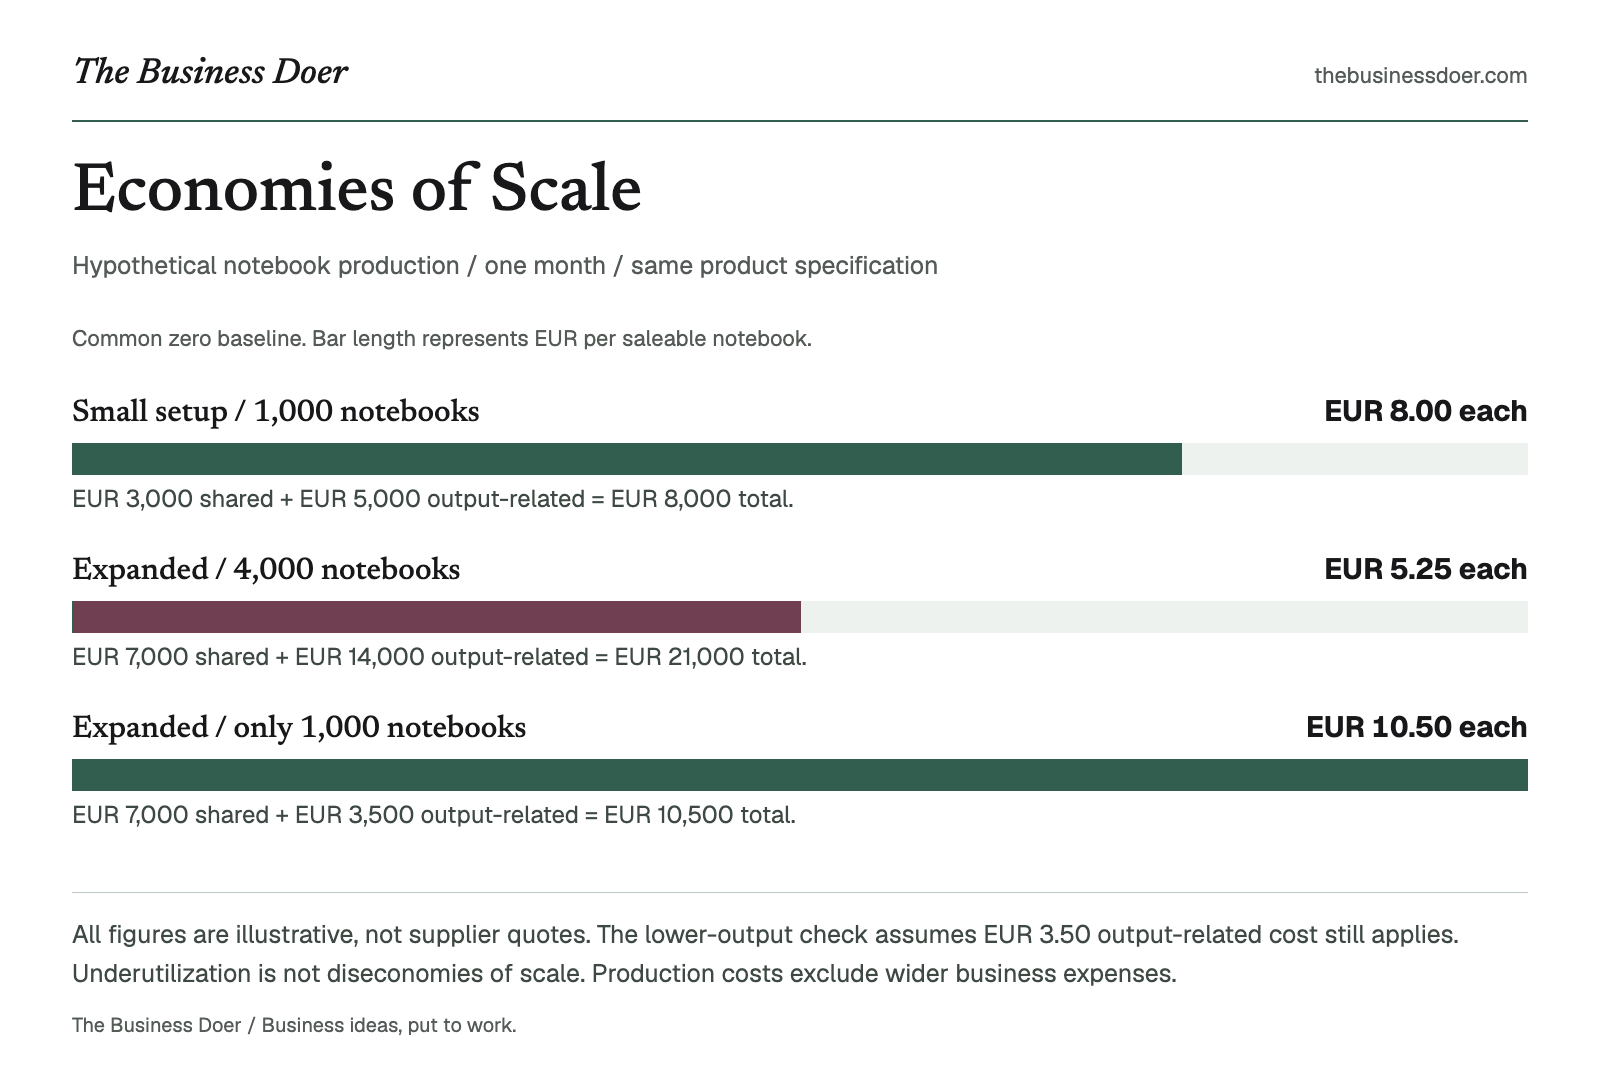
Text version
Hypothetical notebook production / one month / same product specification
- Small setup / 1,000 notebooks
- EUR 8.00 each. EUR 3,000 shared + EUR 5,000 output-related = EUR 8,000 total.
- Expanded / 4,000 notebooks
- EUR 5.25 each. EUR 7,000 shared + EUR 14,000 output-related = EUR 21,000 total.
- Expanded / only 1,000 notebooks
- EUR 10.50 each. EUR 7,000 shared + EUR 3,500 output-related = EUR 10,500 total.
Why do they matter?
The concept helps a business question three decisions: whether to expand production, whether larger orders genuinely reduce costs, and whether a competitor's lower price might rest on a cost advantage rather than a smaller profit margin.
Before expanding, ask: Which cost per unit falls, why does it fall, and what volume is needed?
How they work
Three mechanisms can make larger-scale production cheaper:
Specialization. Sufficient volume lets people concentrate on specific tasks rather than repeatedly switch between unrelated jobs. The saving must show up in resources used per unit, not merely a larger headcount.
Equipment and shared production resources. A process suited to larger batches may need less labor or equipment capacity per item. Production design and other shared work can also support more units without rising in proportion to output.
Purchasing. Larger, predictable orders may secure lower input prices. Check the whole purchasing cost, including delivery and storage, rather than assuming a headline discount is a saving.
Use value chain analysis to locate the activity behind a proposed saving: purchasing, production or another specific step.
The calculation
Average production cost per unit = Total production cost / Units produced
Use the same period, product specification and cost scope for both options. Include the resources needed to operate each setup, not materials alone. The calculation measures average cost; demonstrating economies of scale also requires explaining why scale changes that cost.
A simple example
Hypothetical example: A notebook maker compares two production setups for the same standard notebook. All figures are illustrative. Each option is assumed to be efficiently configured for its stated volume.

Binding equipment, paper and task assignments give the example a concrete setting. This generated workshop is illustrative, not evidence of the production volumes, costs or savings.
The expanded setup uses different binding equipment and task assignments. It is not simply an extra shift in the unchanged workshop. Its materials, labor and other output-related production costs are assumed to fall from EUR 5.00 to EUR 3.50 per notebook.
| Monthly production measure | Small setup | Expanded setup |
|---|---|---|
| Saleable notebooks produced | 1,000 | 4,000 |
| Premises, equipment and shared production costs | EUR 3,000 | EUR 7,000 |
| Materials, labor and other output-related costs | EUR 5,000 | EUR 14,000 |
| Total production cost | EUR 8,000 | EUR 21,000 |
| Average cost per notebook | EUR 8.00 | EUR 5.25 |
For the small setup, EUR 8,000 divided by 1,000 gives EUR 8.00. For the expanded setup, EUR 21,000 divided by 4,000 gives EUR 5.25.
Monthly cost rises by EUR 13,000, but cost per notebook falls by EUR 2.75. The saving combines lower output-related cost per item with shared production costs rising more slowly than output.
These are production costs, not the whole business's expenses. Marketing, distribution and other costs still need consideration before judging profitability.
How to interpret the result
The larger setup looks cheaper at 4,000 notebooks per month. That volume is an assumption, not a forecast.
Suppose weak demand means the expanded operation produces only 1,000 notebooks. Even assuming its EUR 3.50 output-related cost remains available, its cost is EUR 7,000 plus EUR 3,500: EUR 10,500, or EUR 10.50 each. The smaller setup would be cheaper at that volume.
Do not solve this by producing unsold notebooks just to improve the average. The Cost of Goods Sold guide explains why production, inventory and goods actually sold must not be confused.
The next step is to obtain equipment and input quotes, check production assumptions, and verify whether customers will buy the planned volume.
When should you use it?
Use this comparison before expanding a workshop, changing production equipment or committing to larger purchasing volumes. First describe the proposed operating change; then compare its unit cost at realistic output levels.
Common confusion: scale versus capacity utilization
Filling spare capacity in an unchanged facility can lower average cost by spreading existing fixed costs. That alone does not demonstrate long-run economies of scale across alternative facility sizes.
The weak-demand calculation above illustrates underutilization of the chosen setup. It does not establish that efficiently operated larger setups necessarily have higher unit costs.
Common mistakes
- Comparing total spending instead of spending per comparable unit.
- Keeping old overhead assumptions after adding premises or equipment.
- Treating assumed volume discounts as confirmed supplier terms.
- Ignoring defects or changing product quality between the two options.
- Counting planned production as proven customer demand.
Limitations
Scale advantages can run out. More complex coordination and supervision can eventually raise average costs: diseconomies of scale. Lower unit production cost also says nothing by itself about selling price, customer demand or cash needed for expansion.
Quick checklist
Put it to work
Compare two production setups in 25 minutes
Use an existing product and records or quotations already available. The time allowance is for a first comparison, not supplier research or a full investment decision. Missing data should produce a clearly identified research task, not a guessed number.
- Minutes 0-4: Define the comparison. Choose one product specification and period. Describe the present setup and one genuinely different larger setup.
- Minutes 4-11: Complete the cost rows. Separate shared production costs from output-related costs. Include resources needed by the proposed setup and avoid counting any item twice. Record the source, date and whether each amount is observed, quoted or assumed.
- Minutes 11-15: Calculate average costs. Add the production costs of each setup and divide by its stated saleable output. Check matching units and currency.
- Minutes 15-20: Challenge the volume. Recalculate the larger setup at a lower plausible volume. Recheck whether its input prices and labor assumptions would still apply.
- Minutes 20-25: Name the next test. Identify the specific cost-saving mechanism, the least-supported assumption and one action that would verify it.
Finish with: "Expansion may lower unit cost because ___. Before committing, we need evidence for ___."
No result yet. Complete both setups and the lower-output check. Blank amounts are not zero.
- Present setup: enter a positive whole output.
- Present setup: enter shared production costs, including zero if none.
- Present setup: enter output-related cost per unit, including zero if none.
- Larger setup: enter a positive whole output.
- Larger setup: enter shared production costs, including zero if none.
- Larger setup: enter output-related cost per unit, including zero if none.
- Lower-output check: enter a whole output, including zero.
- Lower-output check: explicitly enter the output-related unit cost; do not assume the larger-volume rate still applies.
- Record the product specification.
- Record the comparison period.
- Record the proposed operating change.
- Record the cost-saving mechanism.
- Record the next evidence-gathering action.
Completion criterion: Two documented unit-cost calculations, one lower-volume check and one specific evidence-gathering action. Do not treat the worksheet as a complete profit or cash-flow forecast.
Key takeaways
- Economies of scale mean a lower average cost at a larger operating scale, not lower total spending.
- Specialization, appropriate equipment and purchasing arrangements can create the saving; size alone does not prove it.
- Compare the same product, cost scope and period, with the resources required by each setup.
- A larger setup can be costly when demand leaves it underused.
- Treat the comparison as evidence to investigate, not automatic permission to expand.
Final takeaway
Economies of scale make larger output cheaper per unit, not cheaper in total. Identify the mechanism, compare complete production setups and test whether the necessary volume is realistic. A lower unit cost on paper is useful only when its assumptions hold.