Market Share: What It Is and How to Calculate It
The same market. Two different measures.
On this page
Market share shows how much of a defined market a business captures. Calculate revenue and unit share, compare the bottle example and check the boundaries behind the number.
Market share is the percentage of sales in a defined market that belongs to one company or brand during a specific period. It answers a simple question: out of everything customers bought in this market, how much did this business sell?
The result is useful only when the market, period and sales measure are defined consistently. A company can lead a narrow local market while holding a small national share.
What is market share?
Market share measures a company's sales as a proportion of total sales in the same market. Sales can be measured by revenue, such as euros earned, or by units, such as comparable bottles sold. The company must be included in the market total.
A market should have clear boundaries: the product or service, geographic area, customer group when relevant, and time period. "Coffee sales" is vague. "Revenue from packaged coffee sold to households in Spain during 2026" is much clearer.
Market share is an indicator of competitive position, not a complete measure of business health.

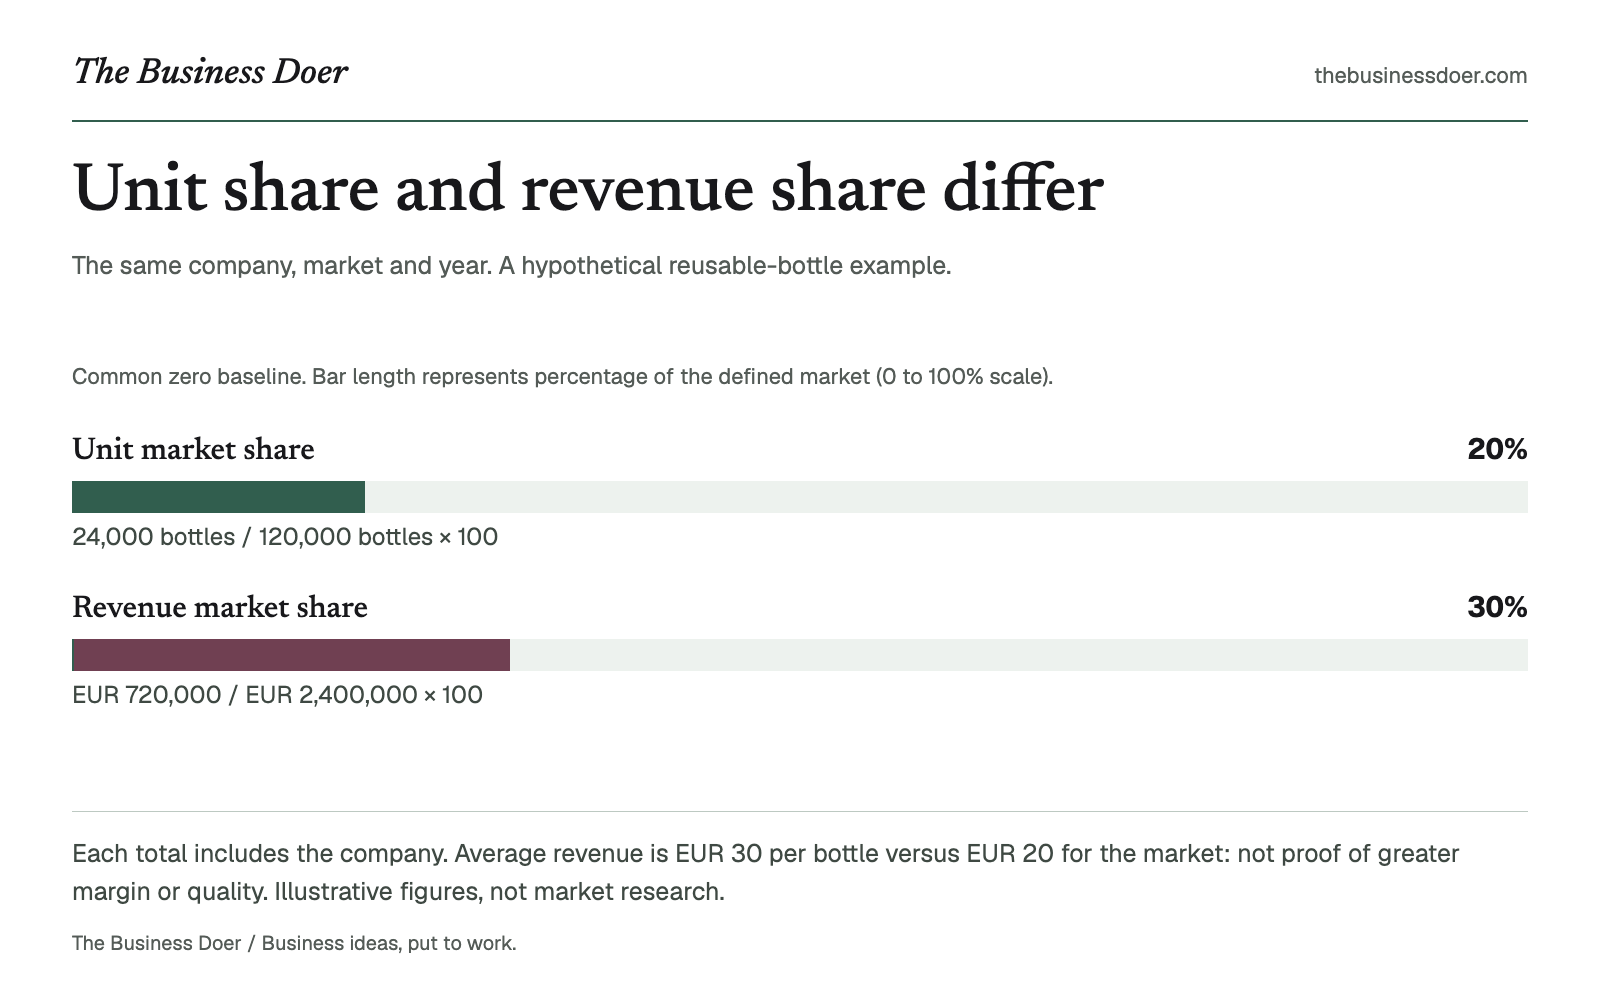
Visual reference. Each total includes the company. Average revenue is EUR 30 per bottle versus EUR 20 for the market: not proof of greater margin or quality. Illustrative figures, not market research.
Text version
The same company, market and year. A hypothetical reusable-bottle example.
- Unit market share
- 20%. 24,000 bottles / 120,000 bottles × 100
- Revenue market share
- 30%. EUR 720,000 / EUR 2,400,000 × 100
Why does it matter?
Market share adds competitive context to sales growth. If company sales rise by 5% while the total market rises by 15%, the company's share falls, provided the definition and measurement basis remain consistent.
Tracking share can help teams:
- Compare performance with overall market demand.
- See whether they are gaining or losing ground against competitors.
- Evaluate results within a target segment or geography.
- Add context to portfolio decisions.
A change prompts questions; it does not explain the cause by itself.
The formula
Market share (%) = Company sales in the defined market ÷ Total sales in that market × 100
Use the same measure in the numerator and denominator:
- Revenue market share compares company revenue with total market revenue, using the same currency and revenue definition.
- Unit market share compares company units with total market units. Define what counts as one comparable unit.
Revenue share captures differences in price and product mix; unit share describes sales volume. Neither is universally better. Do not divide company revenue by market units, or shipments into a channel by retail sales to customers.
Before calculating, define the product or service, geographic area or customer segment, period and measurement basis. Both sales figures must be nonnegative, the total must be positive, and company sales cannot exceed the total for that same market. An impossible result is a data-check signal, not a share above 100% to celebrate.
A simple example
Hypothetical example: A small company sells reusable bottles in one country during one year. Research estimates sales of comparable bottles in the same country and year. All figures below are illustrative, not observed market data.

AI-generated illustrative photograph. It does not document a real company, observed sales or market-share proportions.
| Measure | Company | Whole market, including company | Company share |
|---|---|---|---|
| Bottles sold | 24,000 | 120,000 | 20% |
| Revenue | EUR 720,000 | EUR 2,400,000 | 30% |
Unit share = 24,000 ÷ 120,000 × 100 = 20%. One out of every five comparable bottles sold came from this company.
Revenue share = EUR 720,000 ÷ EUR 2,400,000 × 100 = 30%.
These results can coexist. Company revenue per bottle is EUR 30, compared with EUR 20 across the whole market. On this consistent basis, the company's average selling price is above the market average. That does not establish higher margins, product quality or customer preference: costs and product mix still matter.
When should you use it?
Use market share when you have a defined market and credible estimates for company and total sales. It helps with planning, competitor reviews, segment analysis and monitoring whether growth is faster or slower than the market.
Calculate it at the level where decisions are made. A national result may hide regional differences. Market segmentation identifies meaningful customer groups; your target market clarifies whom you choose to serve. Neither choice automatically supplies a reliable sales denominator.
How to interpret the result
Compare share with an earlier period, direct competitors, other geographies or segments, or the other sales measure. Keep the boundaries unchanged.
Rising share means company sales grew faster than the market, or fell more slowly during a contraction. Falling share means competitors collectively gained ground. Stable share means the company broadly moved with the market. These statements require comparable definitions and a positive market total in both periods.
For example, a rise from 20% to 22% is 2 percentage points, not 2% relative growth. The relative increase in share is 10%: (22 − 20) ÷ 20 × 100. Keep these two descriptions distinct.
Higher share does not prove stronger profitability. Discounts can increase share while weakening margins. Document uncertainty in market estimates rather than presenting an approximate denominator as an exact count.
Common confusion
Market share is not market size. Market size is the total value or volume; share is one company's portion. TAM, SAM and SOM estimate opportunity boundaries, including what may be achievable. Market share measures captured sales within a defined market and period, not an aspiration to win a percentage of TAM.
Market share is not market growth rate. Growth rate describes how the total market changes over time. Share describes the company's position within it.
Absolute share is not relative share. Absolute share uses the total market as the denominator. The BCG Matrix uses relative market share, comparing a business unit's share with the largest competitor's share. A 20% absolute share is not automatically a 0.20 relative-share ratio.
Common mistakes
- Using a vague market definition. Changing the product, customer or geographic boundary can change the result dramatically.
- Mixing revenue and units. Both figures need the same measure, selling stage and treatment of returns or discounts.
- Comparing different periods. Quarterly company sales cannot be divided by annual market sales.
- Using an incomplete denominator. Missing competitors or channels can overstate share. The market total includes your own business.
- Treating share as proof of profitability or quality. Share shows sales position, not margins, satisfaction or operational strength.
Limitations
Market share depends on data quality and chosen boundaries. Private-company sales, informal channels and new categories can make the denominator uncertain. It shows what happened, not why. Use it with growth, profitability, customer and competitive evidence.
Quick checklist
- Is the product or service clearly defined?
- Are geography, customer group and period consistent?
- Are both figures revenue or both comparable units?
- Does the market total include this company and all relevant channels?
- Is the market estimate credible, dated and documented?
- Are comparisons using the same definition, separately from profitability?
Put it to work
In 20 minutes, choose one product, one period and one market definition. Record company sales and total sales on the same basis, with sources, dates and assumptions. If a credible total is unavailable, record the research task instead of inventing a denominator.
Calculate the share and compare it with an earlier period or competitor only if the boundaries match. Finish with two sentences: what the result shows, and what evidence you still need. The worksheet accepts either measure independently; calculating both requires consistent boundaries for all four inputs.
Each market total includes your company. Use matching products, geography, customer group, sales stage and period. Fill either measure or both; no grouping separators. Revenue uses EUR and accepts a decimal point or comma.
Same zero-to-100% scale
- Unit share
- Not calculated: check the two inputs.
- Revenue share
- Not calculated: check the two inputs.
A calculated share does not verify market boundaries or data. Share is not profit, product quality or an explanation of cause. Positive shares below 0.01% are shown as <0.01%, not zero.
Key takeaways
- Market share is captured sales divided by total sales in a defined market, multiplied by 100.
- Revenue share and unit share can differ; neither should be mixed within one ratio.
- Market boundaries and denominator quality matter as much as the arithmetic.
- Compare periods consistently and distinguish percentage points from relative percentage change.
- Share describes competitive position, not profit or a proven cause of performance.
Final takeaway
Market share is a simple ratio. Its usefulness depends less on difficult mathematics than on choosing consistent boundaries and reliable data.
Track it over time and compare like with like. A change in share is a signal to investigate, not a complete explanation of business performance.