Product Life Cycle: What It Is and How the Four Stages Work
Read the signals. Question the stage.
On this page
A product may move through introduction, growth, maturity and decline. Follow a hypothetical lunchbox line, check several signals and keep the stage a working diagnosis, not a forecast.
The product life cycle is a framework that describes how a product’s sales and profitability may change over time through four stages: introduction, growth, maturity and decline. It helps teams match product and marketing decisions to changing market conditions.
The model is a guide, not a timetable. Products may move at different speeds, skip stages or return to growth after a change.
What is the product life cycle?
The product life cycle, often shortened to PLC, organizes a product’s time in the market into four broad stages. The familiar curve plots time against sales. Profitability is sometimes shown separately because launch costs, competition and operating efficiency can make it behave differently.
Some versions add product development before introduction. The four-stage version begins when the product reaches the market.

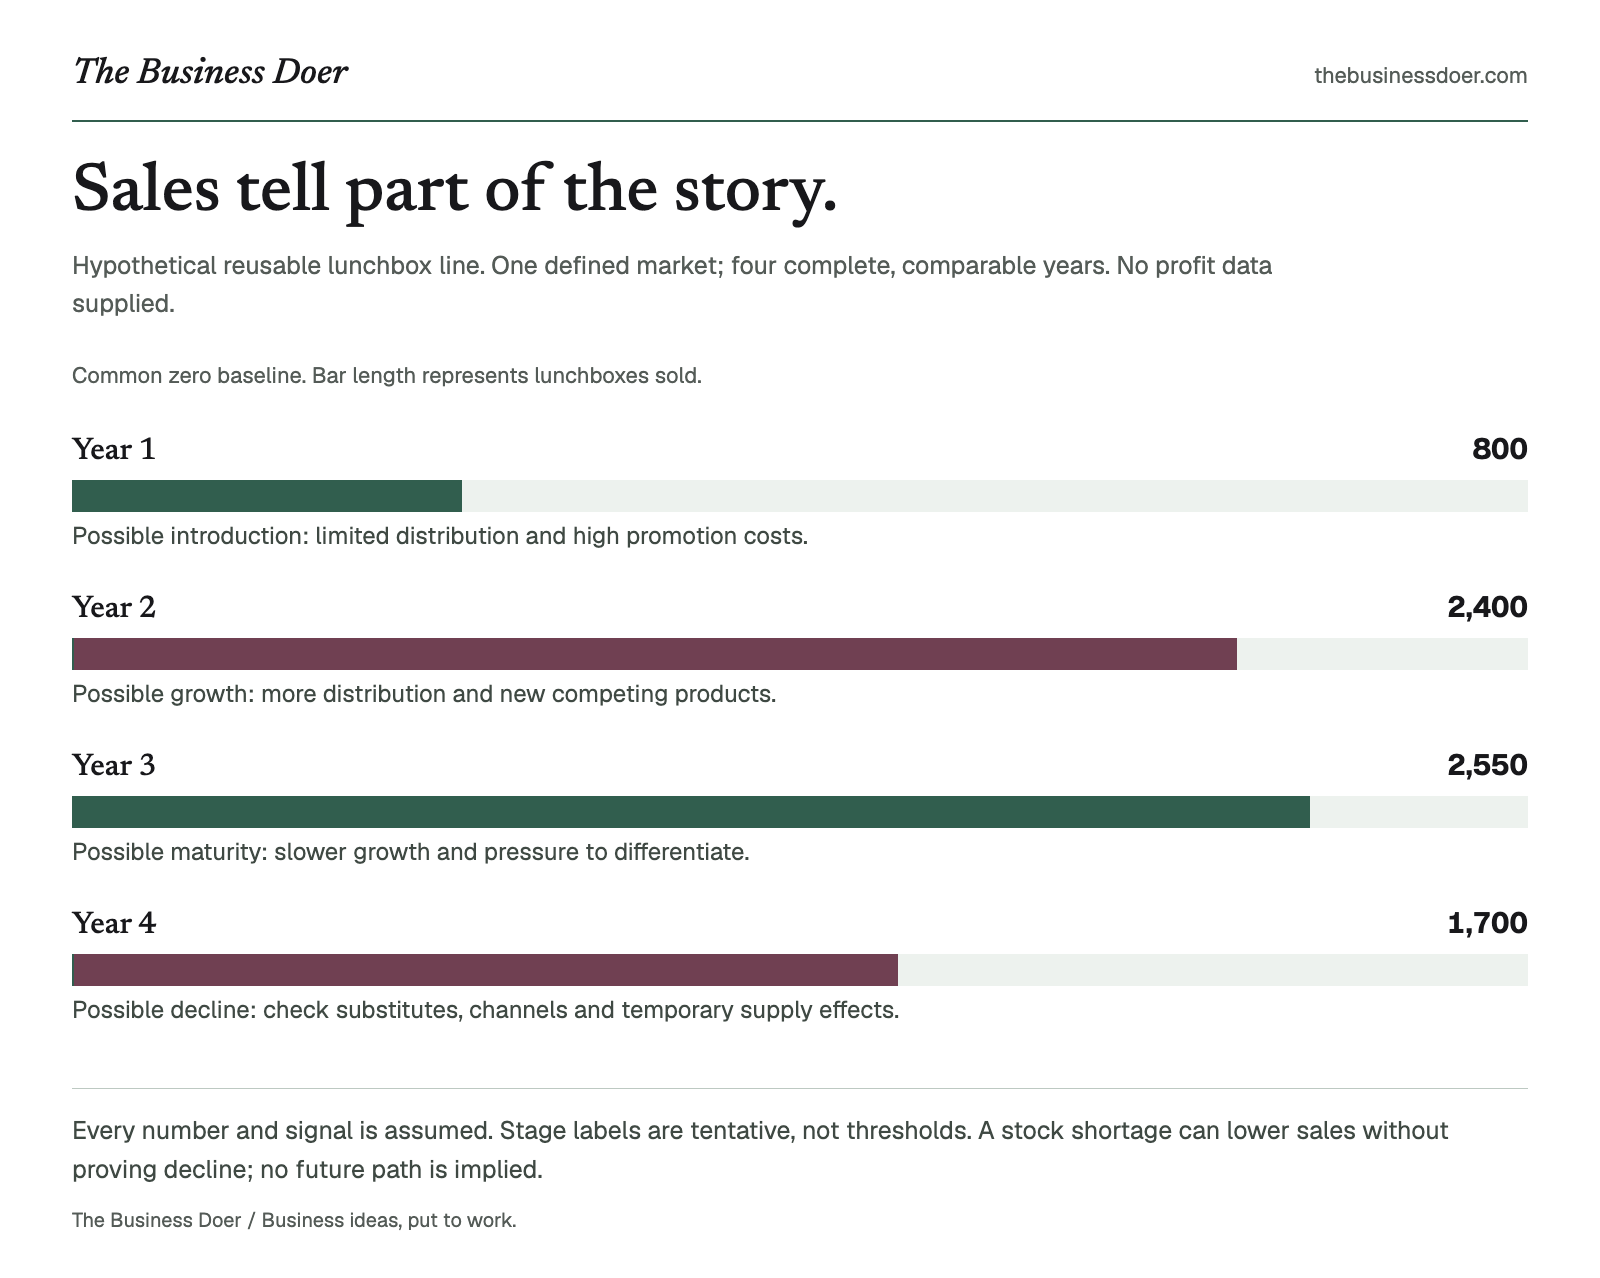
Visual reference. Every number and signal is assumed. Stage labels are tentative, not thresholds. A stock shortage can lower sales without proving decline; no future path is implied.
Text version
Hypothetical reusable lunchbox line. One defined market; four complete, comparable years. No profit data supplied.
- Year 1
- 800. Possible introduction: limited distribution and high promotion costs.
- Year 2
- 2,400. Possible growth: more distribution and new competing products.
- Year 3
- 2,550. Possible maturity: slower growth and pressure to differentiate.
- Year 4
- 1,700. Possible decline: check substitutes, channels and temporary supply effects.
Why does it matter?
Customer awareness, sales growth and competitive pressure rarely remain constant. A newly launched product may need education and trial. A fast-growing product may need capacity and wider distribution. A mature product may need differentiation or efficiency. A declining product may need repositioning, simplification, harvesting or withdrawal.
The framework gives teams a shared language for these changes. It can inform a Product Roadmap, but it does not make decisions automatically.
How do the four stages work?
- Introduction: The product has recently entered the market. Sales are usually low but may begin to rise. Awareness and distribution are limited, and launch or promotional costs can keep profit low or negative.
- Growth: Sales increase quickly as more customers adopt the product. Distribution expands, profitability may improve and competitors may enter. The team often focuses on reliable delivery, product improvement and market reach.
- Maturity: Sales growth slows, levels off or becomes harder to sustain. Competition is established and customers have many alternatives. The business may defend its position through differentiation, service, efficiency, new segments or useful product changes.
- Decline: Sales decrease over a sustained period. Needs, preferences, substitutes, costs or competition may have changed. The business must decide whether to maintain a focused version, reposition it, reduce investment, sell it or withdraw it.
These descriptions are tendencies, not fixed rules. A temporary sales dip does not prove decline, and rapid growth does not guarantee healthy profit.
A simple example
Hypothetical example. A small company launches a reusable lunchbox line in one defined market. All figures and supporting signals below are invented for teaching, not observed customer results. Each row covers one complete year on the same product and market scope.

AI-generated illustrative photograph. This fictional product line does not document a real company, sales history, customer demand or verified product safety.
| Year | Units sold | Other evidence | Possible stage |
|---|---|---|---|
| 1 | 800 | Few stores carry it; promotion costs are high | Introduction |
| 2 | 2,400 | Distribution expands; similar products appear | Growth |
| 3 | 2,550 | Growth slows; retailers ask for clearer differentiation | Maturity |
| 4 | 1,700 | Sales fall across several channels; substitutes gain demand | Possible decline |
Unit sales rise by 200% from year one to two, then by 6.25% from year two to three, before falling by one third (about 33.3%) in year four. These describe this hypothetical series, not universal stage thresholds. Units are not revenue: changing prices or product mix could produce a different revenue pattern. No profit figures are supplied, so the table cannot establish profitability.
The figures alone are insufficient. The company should also review profit, channels, customer research and competitors.
If the year-four fall came from a temporary stock shortage, “decline” would be a poor diagnosis. If demand has shifted for several periods and does not recover after availability returns, the decline interpretation becomes stronger.
When should you use it?
Use the product life cycle during portfolio reviews, annual planning and major investment decisions. It helps frame whether to build awareness, scale delivery, defend a mature position or reduce support.
Review the stage when sales growth, profitability, customer needs, distribution or competition changes materially. Before launch, use a development process such as the Stage-Gate Process instead.
How should you interpret the stage?
Do not assign a stage from one number or one month. Look for a consistent pattern across several signals:
- Sales level and growth rate: Are sales starting, accelerating, flattening or falling?
- Profitability: Are launch costs dominant, margins improving, profits under pressure or returns shrinking?
- Customer and channel evidence: Is awareness expanding? Are channels adding or removing the product?
- Competition: Are rivals entering, crowding the market or leaving?
- Decision context: Which choice might the diagnosis inform? Keep that proposed action separate from evidence; wanting to scale or withdraw does not prove a stage.
State the product, geography, customer group and time period. A product can be mature in one market and still be in introduction in another.
Use the diagnosis to frame choices, then test them with current evidence. A BCG Matrix compares several units at one point; the product life cycle describes how one offering may change over time.
Common confusion
Product life cycle versus customer life cycle: The product life cycle describes an offering’s market pattern. A customer life cycle describes a customer’s relationship with a business, from awareness or acquisition through later behavior.
Product life cycle versus product development: Development happens before market introduction in the common four-stage model. A Minimum Viable Product can help test key assumptions before or around an early launch, but it is not a life-cycle stage.
Product versus category or brand: A category, brand, product line and individual product can show different patterns. Name the exact unit being analyzed.
Common mistakes
- Treating the classic curve as a prediction with fixed stage lengths.
- Declaring decline after one weak period without checking seasonality, supply or other temporary causes.
- Using sales alone and ignoring profitability, customers, channels and competition.
- Applying a category-level pattern to every brand or product inside it.
- Assuming the same stage and strategy apply in every geography or segment.
Limitations
The model simplifies reality. Stage boundaries have no universal thresholds. Seasonality, economic cycles, supply problems, product changes and marketing decisions can distort the curve. Use it as a structured hypothesis, not as proof or a forecast.
Quick checklist
- Have we defined the exact product, market and time period?
- Have we reviewed several periods rather than one data point?
- Do sales, profitability, customer, channel and competitor signals broadly agree?
- Have we ruled out seasonality, stock problems and other temporary effects?
- Does the proposed action fit the evidence and available resources?
- Have we set a date to review the stage again?
Key takeaways
- The four common market stages are introduction, growth, maturity and decline.
- Each stage suggests different questions, but it does not prescribe one automatic strategy.
- Sales, profitability, customer, channel and competitor evidence should be considered together.
- A temporary dip, one strong month or a familiar curve does not prove a stage.
- The model is a working diagnosis, not a timetable or forecast.
Put it to work
A 25-minute product life cycle check
Choose one product and one specific market.
- Define the unit — 3 minutes. Write the product, customer group, geography and period you are analyzing.
- Collect signals — 8 minutes. Note the direction of sales, sales growth, profitability, channel coverage and competitor activity across at least three comparable periods.
- Check alternatives — 5 minutes. List temporary explanations such as seasonality, a stock shortage, a promotion or a one-off contract.
- Choose a tentative stage — 4 minutes. Select introduction, growth, maturity or decline and write the two strongest pieces of supporting evidence.
- Name one decision and one uncertainty — 3 minutes. State the action the diagnosis could inform and the missing fact that matters most.
- Set a review date — 2 minutes. Choose when you will repeat the check.
If the signals conflict, record the stage as uncertain and collect the missing evidence before making a major commitment.
Keep the stage uncertain when signals conflict. Selecting a stage does not validate the evidence or recommend investment or withdrawal.
Final takeaway
The product life cycle helps teams describe how an offering may move through introduction, growth, maturity and decline. Its value is not predicting a perfect curve. Its value is prompting better questions about changing demand, competition, profitability and priorities.
Choose a stage only after reviewing multiple signals, and treat the result as a working diagnosis that must be revisited.