Win Rate: What It Is and How to Calculate It
Count the decisions. Keep open deals visible.
On this page
Win rate shows the share of decided sales opportunities that are won. Explore 14 wins, 21 losses and five open deals, compare denominators and document the rules behind the number.
Win rate is the percentage of eligible sales opportunities that end as closed-won deals. It shows how often a sales team turns genuine opportunities into customers, using a defined period or cohort and a clearly stated denominator.
The arithmetic is simple. The important work is defining opportunity entry, won and lost outcomes, and how unresolved deals are treated.
What is win rate?
Win rate measures successful sales outcomes. In a sales pipeline, an opportunity is marked closed won when the buyer meets the agreed purchase or contract rule. It is marked closed lost when it ends without a sale.
For a closed-outcome rate, compare wins with all decided opportunities:
Win rate (%) = Closed-won opportunities ÷ (Closed-won opportunities + Closed-lost opportunities) × 100
This definition keeps unresolved opportunities out of the denominator rather than treating them as failures. Some organizations divide wins by every opportunity created, including open deals. That answers a different question and must be labeled separately.

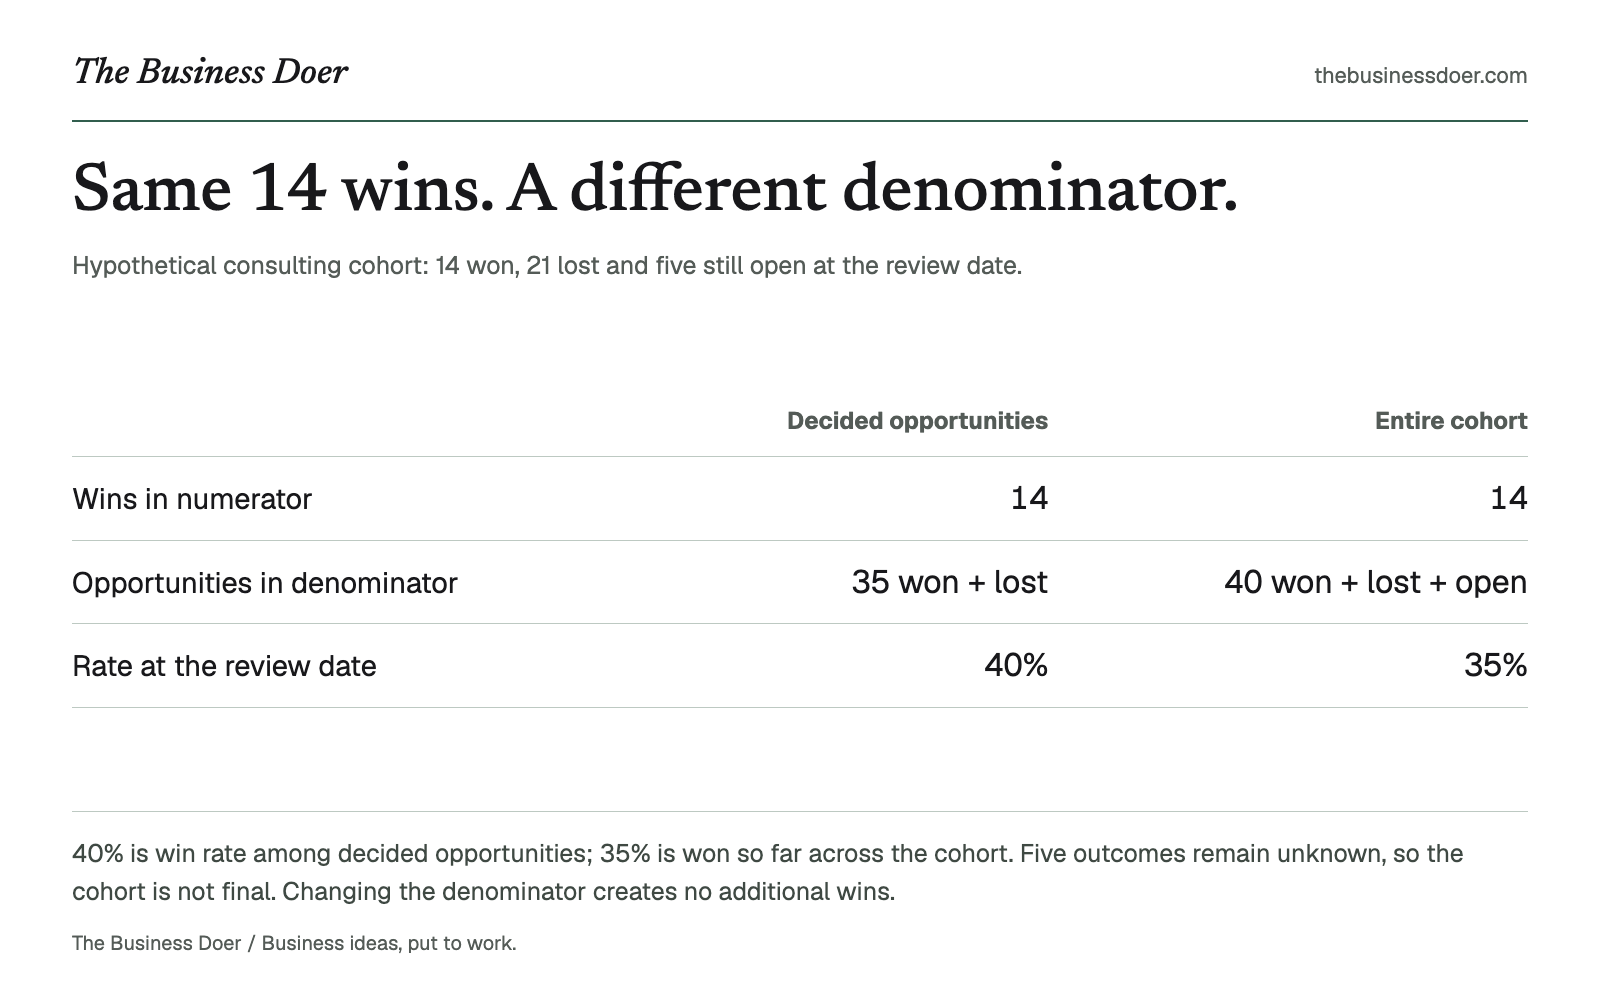
Visual reference. 40% is win rate among decided opportunities; 35% is won so far across the cohort. Five outcomes remain unknown, so the cohort is not final. Changing the denominator creates no additional wins.
Text version
Hypothetical consulting cohort: 14 won, 21 lost and five still open at the review date.
- Wins in numerator
- Decided opportunities: 14; Entire cohort: 14
- Opportunities in denominator
- Decided opportunities: 35 won + lost; Entire cohort: 40 won + lost + open
- Rate at the review date
- Decided opportunities: 40%; Entire cohort: 35%
Why does it matter?
Ten wins may be strong out of 20 decisions but weak out of 100. The denominator gives the count context.
Teams can use win rate to compare periods, segments, products or channels; support a sales forecast; identify where a win-loss review would help; and question whether qualification is too broad or too narrow. It is also one input in sales velocity.
A change is a signal, not an explanation of why buyers chose the offer or walked away. There is no universal percentage every business should aim for.
The components
Define four elements before comparing results:
- Opportunity entry: the observable rule that turns a lead into an eligible opportunity. BANT qualification is one way to structure that discussion, not a guarantee of a sale.
- Won outcome: the event that confirms a sale, such as a signed contract or completed purchase.
- Lost outcome: the event that closes an opportunity without a sale. Document how no-decision outcomes, disqualification and reopened deals are handled.
- Measurement basis: opportunities closed in a stated period, or a cohort followed to a stated review date.
Count distinct opportunities once under the documented rules. Numerator and denominator must describe the same population. Do not use wins from one segment and losses from another, or quietly remove genuine losses to improve the percentage.
A simple example
Hypothetical example: A small consulting studio reviews a cohort of 40 qualified opportunities. At the review date:

AI-generated illustrative photograph. It does not document a real consulting firm, opportunity cohort or observed sales outcomes.
| Status | Opportunities | Treatment |
|---|---|---|
| Closed won | 14 | Numerator and closed-outcome denominator |
| Closed lost | 21 | Closed-outcome denominator |
| Still open | 5 | Report separately; unresolved |
| Total cohort | 40 | 14 + 21 + 5 |
There are 35 decided opportunities: 14 + 21.
Closed-outcome win rate = 14 ÷ (14 + 21) × 100 = 40%.
The studio won 40% of the opportunities that have reached a decision so far. Because five remain open, this is not yet the cohort's final outcome. Faster-closing deals may differ from those still open.
Dividing 14 wins by all 40 gives 35% won so far across the entire cohort. This is a separately labeled all-created measure, not the same closed-outcome rate. The denominator changed; the sales did not. Report both definitions and the five unresolved deals rather than comparing 35% with 40% as if performance improved.
When should you use it?
Use win rate when a defined pipeline records eligible opportunities and outcomes reliably. Choose one timing method:
- Closed-date view: count deals marked won or lost during a period. This is timely, but they may have entered the pipeline at different times. An open pipeline snapshot is not a set of opportunities closed during that period.
- Cohort view: follow opportunities created or qualified in the same period. Report the review date and open count while it is incomplete; a final cohort rate requires all eligible outcomes to be resolved under the same rules.
Either can be useful. Keep the method consistent when comparing results. The worksheet below uses a cohort snapshot, not a closed-date report or an individual-deal forecast.
How to interpret the result
A higher rate means a greater share of the measured opportunities was won; a lower rate means a smaller share. Interpret it alongside the number of decisions, average deal size, total won value, sales cycle length, segment mix and recorded win-loss evidence.
A high rate is not automatically ideal. Opening opportunities only when a purchase is nearly certain can produce a strong percentage and a small pipeline. A lower rate may accompany entry into a new segment. Changed qualification rules make a simple before-and-after comparison unreliable.
Keep underlying counts. One win out of two is 50%, but it is much less evidence than 50 wins out of 100. A change from 35% to 40% is 5 percentage points, not 5% relative growth. Neither number tells you whether deals were profitable or paid.
Common confusion
Win rate is not top-of-funnel conversion. A sales funnel can measure movement between many stages. Win rate focuses on eligible opportunities and final won/lost outcomes under the chosen basis.
Win rate is not the number of wins. Twenty wins out of 40 decisions differ from twenty out of 100. Always keep the denominator visible.
Deal-count win rate is not value-weighted win rate. This guide counts each opportunity once. A value-weighted version compares potential value won with the comparable value of decided opportunities. It needs a documented amount basis and is not interchangeable with a deal count.
A closed-outcome rate in an incomplete cohort is not final cohort conversion. Open deals remain unknown, not automatic losses or wins.
Common mistakes
- Changing opportunity criteria. Teams with different entry rules do not have directly comparable rates.
- Including open deals without saying so. The denominator changes the question being answered.
- Mixing periods or cohorts. Wins and losses must follow the same measurement basis.
- Leaving stale opportunities open indefinitely. Review them against a documented closure rule, without inventing outcomes.
- Reading causation into the percentage. A rate describes outcomes, not why buyers made their decisions.
Limitations
Win rate depends on accurate records and disciplined closing. It can hide deal value, fit, cycle length and strategic importance. Small samples and uneven time to decision can distort comparisons. Use volume, value, timing and win-loss evidence together. With no decided opportunities, closed-outcome win rate is undefined, not 0%.
Quick checklist
- Is an eligible opportunity clearly defined?
- Are won and lost outcomes observable and recorded consistently?
- Are open, no-decision and reopened opportunities handled explicitly?
- Do wins and losses use the same period or cohort?
- Are comparisons based on matching entry and closure rules?
- Are deal count, value and sales-cycle context reviewed alongside the rate?
Put it to work
In 20 minutes, define opportunity entry and the won/lost rules. Choose a cohort and record its review date. Count won, lost and open opportunities separately, retaining sources and unresolved record questions.
Calculate wins divided by wins plus losses. Report the open count beside it and do not call an incomplete cohort final. Compare with an earlier period or segment only if the rules and maturity are comparable. Finish with one factual observation and two questions to investigate before explaining a change.
- Decided opportunities
- Not calculated
- Entire cohort
- Not calculated
- Win rate among decided
- Undefined or incomplete: check the counts.
- Won so far / entire cohort
- Undefined or incomplete: check the counts.
Cohort finality is not established. Open or missing outcomes must not be treated as losses.
Different denominators answer different questions. No decided opportunities means an undefined win rate, not 0%. This measures counts, not profit, cash or cause.
Rates display up to two decimals. Tiny positive values use <0.01%; values just below 100% use >99.99% rather than a false endpoint.
Key takeaways
- Closed-outcome win rate is wins divided by wins plus losses, multiplied by 100.
- Open opportunities are unresolved and reported separately.
- An all-created denominator answers a different question; label it explicitly.
- Qualification, timing, cohort maturity and record hygiene affect interpretation.
- A percentage does not establish profit, cash received or the reason for the outcome.
Final takeaway
Win rate becomes useful when eligibility, outcomes and timing stay consistent. Show the underlying counts, label the denominator and keep open deals visible.
Compare like with like and investigate the evidence behind a change before deciding what caused it.