Bottom-Up Market Sizing: How to Estimate a Market from Customer-Level Data
Count the buyers. Expose the assumptions.
On this page
Bottom-up market sizing estimates a market by starting with small, observable units, such as customers, subscriptions or transactions, and building upward. Instead of beginning with a large industry total and applying percentages, you estimate how many relevant buyers exist and how much each could reasonably spend.
The method is useful because its assumptions are visible. A reader can check the customer count, spending estimate and segments instead of accepting one headline number.
What is bottom-up market sizing?
Bottom-up market sizing estimates market value from the units that create demand. For a simple customer-based market:
Bottom-up market size = Number of potential customers x Average annual spending per customer
If customer groups spend differently, calculate each segment separately and add the results:
Market size = Sum of (Customers in each segment x Annual spending per customer)
The unit does not have to be a customer. A transaction-based business might use transactions per year x revenue per transaction. The key is to build from clearly defined units. Do not mix customer spending, transaction value and a platform's fee revenue in the same total.

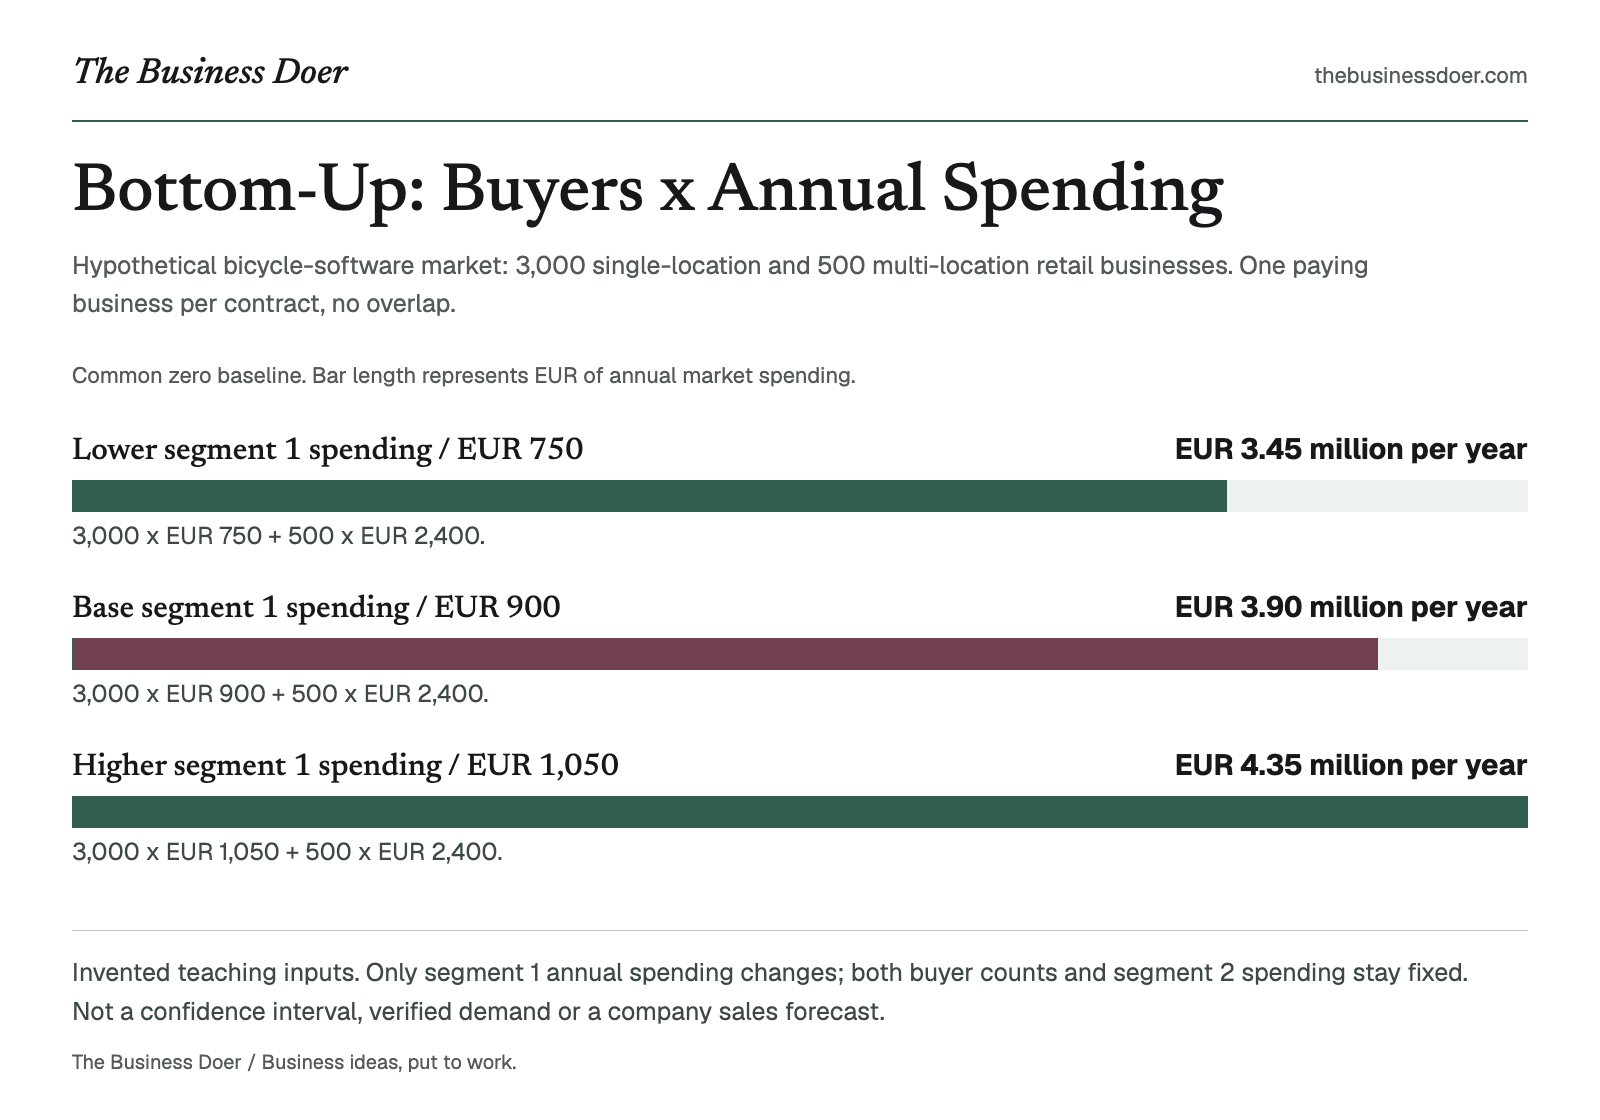
Visual reference. Invented teaching inputs. Only segment 1 annual spending changes; both buyer counts and segment 2 spending stay fixed. Not a confidence interval, verified demand or a company sales forecast.
Text version
Hypothetical bicycle-software market: 3,000 single-location and 500 multi-location retail businesses. One paying business per contract, no overlap.
- Lower segment 1 spending / EUR 750
- EUR 3.45 million per year. 3,000 x EUR 750 + 500 x EUR 2,400.
- Base segment 1 spending / EUR 900
- EUR 3.90 million per year. 3,000 x EUR 900 + 500 x EUR 2,400.
- Higher segment 1 spending / EUR 1,050
- EUR 4.35 million per year. 3,000 x EUR 1,050 + 500 x EUR 2,400.
Why does it matter?
A bottom-up estimate forces you to answer practical questions: Who can buy? How many relevant buyers exist? What would each spend in a year? Do different groups need separate assumptions?
This makes the estimate easier to challenge and improve. It can also reveal that a market is smaller, or structured differently, than a broad industry figure suggests.
How it works
1. Define the market question
State the offer, paying customer, geography, period and unit.
For example: "Annual market value for inventory-management software sold to independent bicycle retailers in one country."
An ideal customer profile can help make the B2B buyer definition precise. A good profile supports a count; it does not itself establish how many matching buyers exist or whether they will buy.
2. Count the potential customers
Find the number of buyers that genuinely match the definition. Useful sources can include government business statistics, industry directories, trade associations and primary research. Do not count every organization that could theoretically use the product.
Match the counting unit to the purchasing unit. If one retailer buys one contract for several shops, count the paying retailer once rather than count its locations as separate customers. Keep segment boundaries non-overlapping, and record each source's date and coverage.
3. Estimate annual spending per customer
Use the annual amount a typical customer would pay for the relevant product or service. That might be an annual subscription, units purchased x price, transactions x revenue per transaction, or average annual contract value.
Use observed prices or customer research when possible. Label assumptions clearly. A monthly price must be converted to a comparable annual amount; a list price alone does not prove realized spending, willingness to pay or full-year adoption.
4. Segment when averages hide differences
If customer groups have meaningfully different spending levels, calculate them separately. A single-location retailer and a multi-location retailer may not buy the same plan.
5. Add the segments and test uncertainty
Sum the segment estimates. Then change the most uncertain input to a reasonable low and high value, holding the other inputs constant.
The goal is not a perfect number. It is an estimate whose logic can be inspected and updated. A one-input sensitivity range is not a confidence interval or a complete assessment of uncertainty.
A simple example
Hypothetical example: A company is estimating the annual market for inventory-management software sold to independent bicycle retailers in one country. The counts and spending amounts are invented teaching assumptions, not a verified national market study.
Each customer is one paying retail business. The two segments do not overlap: the first has one location per buyer; the second has several locations covered by one annual contract per buyer.
| Customer segment | Paying businesses | Annual spending per business | Annual market estimate |
|---|---|---|---|
| Single-location retailers | 3,000 | EUR 900 | EUR 2,700,000 |
| Small multi-location retailers | 500 | EUR 2,400 | EUR 1,200,000 |
| Total | 3,500 | Segment-specific, not one blended price | EUR 3,900,000 |
The bottom-up estimate is EUR 3.9 million per year: (3,000 x EUR 900) + (500 x EUR 2,400).
If the EUR 900 annual spending assumption for single-location retailers could reasonably range from EUR 750 to EUR 1,050, the total market would range from EUR 3.45 million to EUR 4.35 million per year, holding both customer counts and the second segment's spending constant.
| Single-location annual spending | Calculation, with second segment fixed | Total annual estimate |
|---|---|---|
| EUR 750: lower input | (3,000 x EUR 750) + EUR 1,200,000 | EUR 3,450,000 |
| EUR 900: base input | (3,000 x EUR 900) + EUR 1,200,000 | EUR 3,900,000 |
| EUR 1,050: higher input | (3,000 x EUR 1,050) + EUR 1,200,000 | EUR 4,350,000 |
The range makes one uncertain assumption visible. It does not show that these spending levels or buyer counts have been validated.

An independent bicycle retailer provides a concrete setting for defining the software buyer. This generated scene is illustrative, not a real customer or evidence of buyer counts, annual spending or software adoption.
When should you use it?
Use bottom-up market sizing when you can identify the customer base and estimate realistic spending at customer or transaction level.
It is useful for evaluating an opportunity, comparing segments, checking an external market report or testing whether a broad market claim is plausible. It is less useful when buyer counts are unavailable, purchase behavior is highly unpredictable or the market is so new that current spending poorly represents future demand.
How to interpret the result
A bottom-up result is an estimate of the market defined by your inputs. It is not automatically the revenue your business will earn. Sales also depend on reach, conversion, competition, capacity and time.
The result also does not automatically tell you whether it represents TAM, SAM or SOM. Those are market definitions; bottom-up sizing is a calculation method. See TAM, SAM and SOM for that distinction.
A strong estimate lets another person trace the result back to customer counts, spending assumptions and segment definitions.
Common confusion
Bottom-up vs top-down market sizing
Bottom-up sizing starts with customers, transactions or another small unit and builds upward. Top-down market sizing starts with a broad market figure and narrows it through filters.
Neither method is automatically correct. Comparing both can expose weak assumptions; first check that they describe the same market boundary, period and value measure.
Bottom-up market size vs sales forecast
A market estimate describes the opportunity. A sales forecast estimates what one company expects to sell over a period.
Do not turn market size into expected revenue by assuming an arbitrary share.
Common mistakes
- Counting customers that do not fit the target market, or counting one paying company twice across locations or overlapping segments.
- Using a list price as if every customer would spend the same amount.
- Mixing monthly and annual figures, currencies or value measures.
- Applying one average when customer segments differ materially.
- Reporting a precise total without showing the assumptions or their evidence.
Limitations
Bottom-up sizing depends on granular data. Customer counts can be incomplete, prices may not equal actual spending, and current purchasing behavior can change. In emerging markets, today's customer base may also understate future demand.
The calculation does not prove demand, adoption, profitability or a company's ability to capture the market. Test important assumptions rather than treating precise arithmetic as precise knowledge.
Quick checklist
Put it to work: a 20-minute sizing exercise
- Define one market in a single sentence: offer, paying customer, geography and one-year period.
- Find one credible source for the number of relevant buyers. If the source counts locations, reconcile them to the paying-customer unit.
- Estimate annual spending per customer from observed pricing, purchase frequency or customer research. Mark unsupported assumptions rather than inventing evidence.
- Split the market into two non-overlapping segments only if their spending is materially different.
- Calculate each segment and add the results.
- Change the most uncertain count or spending assumption to reasonable low and high values and recalculate, holding the others constant.
- Write what the result measures, what it does not prove and which assumption needs the next evidence check.
The exercise is complete when another person can reproduce the calculation and identify the assumption that deserves the most additional research. Twenty minutes is for an initial model using available evidence, not a completed market study.
This worksheet uses paying customers x annual spending. Count businesses, not their locations, when one business holds the contract. Zero is allowed; blank is not zero.
No result yet. Enter valid buyer counts and annual spending for each active segment and valid sensitivity inputs when enabled.
- Segment 1 buyer count: Enter 0 to 1,000,000 whole buyers, without separators.
- Segment 1 annual spending: Enter an amount; blank is not zero.
- Record the offer.
- Record the paying customer and counting unit.
- Record the geography.
- Record the one-year period.
- Record the interpretation and limits.
- Record the next evidence check.
- Record the segment 1 name.
- Record the segment 1 count evidence or labeled assumption.
- Record the segment 1 spending evidence or labeled assumption.
Key takeaways
- Bottom-up market sizing starts with customers, transactions or another small unit and builds upward.
- The basic customer-based calculation is potential customers x average annual spending per customer.
- Segment customers when one average would distort the result; do not double-count buyers.
- A market-size estimate describes an opportunity, not revenue one company will necessarily win.
- Strong estimates expose assumptions and test uncertain inputs with a reasonable range.
Final takeaway
Bottom-up market sizing turns customer-level evidence into a transparent estimate of market value. Define the buyer, count relevant buyers, estimate realistic annual spending and separate segments when their economics differ.
The best result is not the largest number. It is the estimate another person can understand, reproduce and improve.