Top-Down Market Sizing: How to Estimate a Market from Broad Data
Start broad. Check every denominator. Show the assumptions.
On this page
Top-down market sizing estimates a market by starting with a broad, credible figure and narrowing it with evidence-based filters. Instead of counting potential customers one by one, you begin with a larger market and remove the parts that do not match your product, customer, geography or use case.
It can support early decisions, but the result is only as strong as the starting data and the logic of the filters.
What is top-down market sizing?
A top-down estimate moves from a broad market to a narrower one. For an annual monetary baseline, a simple structure is:
Top-down market estimate = Broad annual market spending x Relevant product share x Target-customer share x Geographic share
You do not need exactly three filters. Use only the filters needed to match the market you are trying to estimate. Every percentage must describe the share of spending remaining after the previous step, with the same currency, annual period and measurement basis. These are conditional shares, not independent percentages of the original total.
Precise multiplication does not make weak assumptions reliable. Do not apply a filter again if its restriction is already included in the baseline.

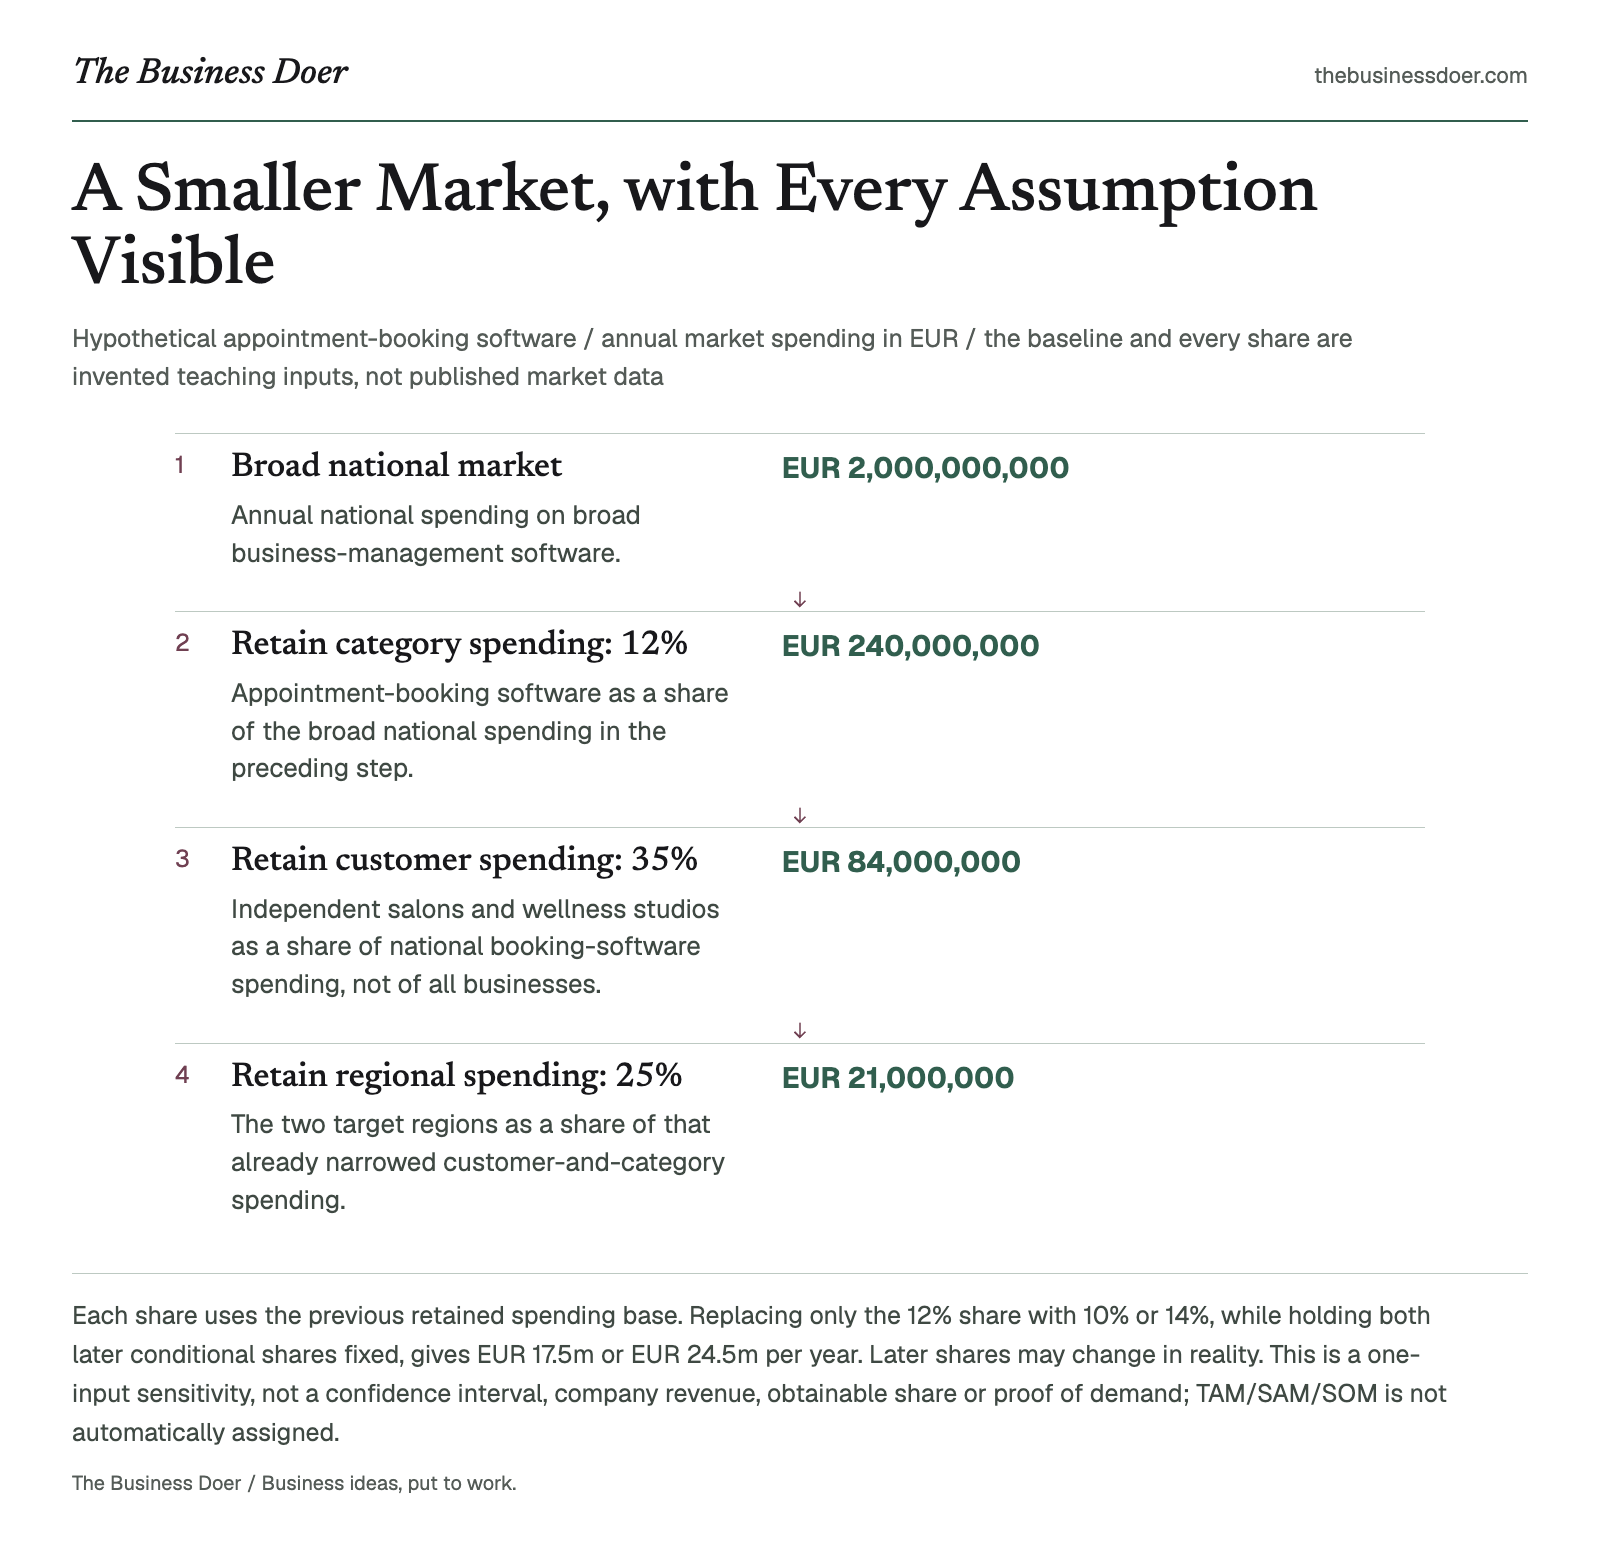
Visual reference. Each share uses the previous retained spending base. Replacing only the 12% share with 10% or 14%, while holding both later conditional shares fixed, gives EUR 17.5m or EUR 24.5m per year. Later shares may change in reality. This is a one-input sensitivity, not a confidence interval, company revenue, obtainable share or proof of demand; TAM/SAM/SOM is not automatically assigned.
Text version
Hypothetical appointment-booking software / annual market spending in EUR / the baseline and every share are invented teaching inputs, not published market data
- Broad national market
- EUR 2,000,000,000. Annual national spending on broad business-management software.
- Retain category spending: 12%
- EUR 240,000,000. Appointment-booking software as a share of the broad national spending in the preceding step.
- Retain customer spending: 35%
- EUR 84,000,000. Independent salons and wellness studios as a share of national booking-software spending, not of all businesses.
- Retain regional spending: 25%
- EUR 21,000,000. The two target regions as a share of that already narrowed customer-and-category spending.
Why does it matter?
Top-down sizing can help a business:
- Screen an opportunity before deeper research.
- Compare markets using the same logic.
- Expose which assumptions drive an estimate.
- Cross-check a more detailed bottom-up calculation.
It works best when credible aggregate industry, government or trade data exists but customer-level data is limited.
How it works
1. Define the market question
State the offer, paying customer, geography, period and unit before looking for a number.
"Business software in Europe" is too broad. "Annual spending on appointment-booking software by independent salons and wellness studios in two target regions" is much more useful.
An ideal customer profile can help define which businesses belong in the customer filter. It does not establish their share of spending: that needs separate evidence.
2. Find a relevant baseline
Choose a credible figure connected to the market you want to estimate. Possible sources include government statistics, industry associations and reputable market-research reports.
Record the source, date, geography, currency, annual period and what the figure measures. Market revenue or spending is different from customers, shipments or transactions. A share of business counts is not automatically a share of spending.
3. Check the baseline
Ask whether the product category, geography, period and unit match your question. If the starting figure is only loosely related, every later step inherits that weakness.
Check which restrictions the baseline already includes. A figure already limited to appointment-booking software does not need another booking-software product filter. A regional baseline does not need the same geographic restriction again.
4. Apply filters in order
Typical filters include product category, customer type, geography, industry, regulation or distribution constraints. For each filter, write its meaning, its conditional base and the evidence or assumption behind its percentage. Show the value remaining after each step.
For example, after selecting booking software, the customer share must refer to spending on booking software, not all business software. After selecting independent salons and wellness studios, the geographic share must refer to that customer segment's booking-software spending.
Multiplication is commutative, but the interpretation of these shares is not. Rearranging the filter order requires new conditional denominators and evidence; reusing the same percentages in a different order does not validate a new chain.
5. Test the assumptions
Change the most uncertain filter to a reasonable low and high value, keeping the other inputs constant for that comparison. Then compare with another source or a bottom-up market sizing estimate using the same boundary, period and value measure.
If the methods disagree materially, investigate the definitions and evidence instead of averaging the numbers. A one-filter sensitivity range does not capture all the model's uncertainty.
A simple hypothetical example
Hypothetical example: A small software company is evaluating appointment-booking software for independent salons and wellness studios in two target regions of one country.
Every number below is a hypothetical teaching assumption, including the EUR 2.0 billion baseline. No figure is an actual reported market value, source quote or survey finding. Assume all figures refer to the same illustrative year and annual EUR spending basis.

A fictional hair-studio booking moment illustrates the service context. This scene is not a survey, a real app interface or evidence of customer satisfaction.
| Step | Spending share and its conditional base | Calculation | Annual spending remaining |
|---|---|---|---|
| Broad national baseline | All annual national spending on the defined broad business-management software category | Hypothetical starting amount | EUR 2,000,000,000 |
| Product filter | Booking software is 12% of that broad national annual spending | EUR 2,000,000,000 x 12% | EUR 240,000,000 |
| Customer filter | Independent salons and wellness studios account for 35% of the national booking-software spending selected in the previous step | EUR 240,000,000 x 35% | EUR 84,000,000 |
| Geographic filter | The two target regions account for 25% of that independent-salon and wellness-studio booking-software market's spending | EUR 84,000,000 x 25% | EUR 21,000,000 |
EUR 2,000,000,000 x 12% x 35% x 25% = EUR 21,000,000 in annual market spending.
All three shares describe spending, not business counts. The 35% uses the EUR 240 million national booking-software base; the 25% uses the EUR 84 million national independent-salon and wellness-studio booking-software base. Neither is a standalone percentage of the original EUR 2 billion.
The company cannot infer that it will earn EUR 21 million. This is not a sales forecast, profit estimate, obtainable share or proof of demand.
Test one assumption
Replace only the 12% product share with 10% and 14%, keeping the EUR 2 billion baseline, 35% customer share and 25% geographic share constant:
| Product spending share | Calculation, with the other inputs held constant | Annual estimate |
|---|---|---|
| Low: 10% | EUR 2,000,000,000 x 10% x 35% x 25% | EUR 17,500,000 |
| Base: 12% | EUR 2,000,000,000 x 12% x 35% x 25% | EUR 21,000,000 |
| High: 14% | EUR 2,000,000,000 x 14% x 35% x 25% | EUR 24,500,000 |
The EUR 17.5 million to EUR 24.5 million range is a one-filter sensitivity comparison, not a confidence interval or a forecast accounting for all uncertain inputs together. Holding the later conditional shares constant is a teaching assumption: in reality, those shares may vary when the product boundary or its estimated share changes. Investigate that relationship before using the range in a decision.
When should you use it?
Use top-down market sizing when evaluating a new market, comparing geographic opportunities, preparing an early business case or checking a bottom-up estimate.
It is less useful when the broad category poorly matches the offer or reliable aggregate data does not exist.
How should you interpret the result?
Treat the output as an estimate with a visible chain of assumptions. A useful result lets a reader trace the number from its source through every filter.
It becomes stronger when definitions stay consistent, the filters have supporting evidence and another method points to a compatible result. Agreement alone does not prove accuracy if both methods rely on the same weak assumptions.
Market size describes opportunity. It does not tell you how much your business will capture, whether customers will buy or whether the business will be profitable.
Common confusion: top-down sizing vs TAM, SAM and SOM
Top-down market sizing is a method. TAM, SAM and SOM are market definitions.
A top-down method can estimate a TAM or SAM when the stated boundary fits that definition. It does not automatically produce a credible SOM.
A realistic SOM requires evidence about sales capacity, distribution, competition and operational limits over a defined period. Choosing "1% of a huge market" is not a substitute.
Common mistakes
- Starting with a market that is only loosely related to the actual offer.
- Multiplying percentages with different or unclear denominators, or treating separate marginal shares as conditional shares.
- Applying a restriction that the baseline already includes.
- Using business-count shares as spending shares without evidence.
- Mixing customers, units and revenue, or ignoring the source's date, currency, annual period and geographic scope.
- Reporting a precise answer when the assumptions are approximate.
- Presenting a one-filter sensitivity range as a confidence interval or complete uncertainty model.
Limitations
Top-down estimates inherit the weaknesses of their source data. Published categories may be broader than your offer, segment shares may be outdated and national averages may not reflect local conditions.
The calculation cannot verify that a source is credible or that conditional denominators are compatible. Those are research and judgment tasks. Use top-down sizing as one evidence-based estimate, not as proof of demand or investment guidance.
Quick checklist
Put it to work
Build a first top-down estimate in 25 minutes
- Define the offer, paying customer, geography, annual period and monetary unit in one sentence.
- Find one credible broad annual market figure. Record its source, date, geography, currency and measurement basis.
- Write two to four ordered percentage filters needed to reach your target market. Exclude restrictions already included in the baseline.
- Record each filter's meaning, conditional base and evidence or explicit assumption. Check that each spending share refers to the amount remaining after the previous step.
- Calculate the remaining market after every step, retaining precision until the final monetary display.
- Change one uncertain filter to reasonable low and high values around its base value. Hold other inputs constant for the comparison and explain that limitation.
- Write what the estimate measures, what it does not prove and which assumption needs the next evidence check. Manually review comparability and the full chain before relying on the result.
The exercise is complete when another person can reproduce the estimate and identify the assumption that matters most. Twenty-five minutes is for an initial model using available evidence, not a completed market study.
This worksheet measures annual monetary spending, not buyers, shipments or transactions. A blank amount is not zero. Changing currency does not convert it.
No estimate yet. Record the market boundary, baseline and conditional filters, then confirm your review. A precise calculation cannot validate weak assumptions.
Review incomplete entries (23)
- Broad annual market: Enter a value; blank is not zero.
- Filter 1: Enter a value; blank is not zero.
- Filter 2: Enter a value; blank is not zero.
- Filter 3: Enter a value; blank is not zero.
- Review the market boundary, compatible spending bases and source assumptions before calculating.
- Record the offer.
- Record the paying customer.
- Record the target geography.
- Record the one-year period.
- Record the baseline source or explicitly labeled assumption.
- Record the source date or explicit missing-date limitation.
- Record the baseline scope and spending unit.
- Record the interpretation and limits.
- Record the next evidence check.
- Record the filter 1 name.
- Record the filter 1 conditional spending base.
- Record the filter 1 evidence or explicit assumption.
- Record the filter 2 name.
- Record the filter 2 conditional spending base.
- Record the filter 2 evidence or explicit assumption.
- Record the filter 3 name.
- Record the filter 3 conditional spending base.
- Record the filter 3 evidence or explicit assumption.
Key takeaways
- Top-down market sizing starts broad and narrows the market with explicit filters.
- The quality and definition of the starting data matter as much as the calculation.
- Each filter needs a clear meaning, evidence and a conditional base matching the previous step.
- Test uncertain inputs without presenting a limited sensitivity range as complete uncertainty.
- Market size is not expected business revenue, profit or proof of demand.
Final takeaway
Top-down market sizing turns a broad market figure into a transparent estimate of a more relevant opportunity.
Start with a credible baseline, narrow it with defensible filters, show every step and test the assumptions that drive the answer. The goal is an estimate another person can understand, challenge and improve.