Sales Cycle Length: What It Is and How to Calculate It
Define the clock. Read the deals behind the average.
On this page
Sales cycle length measures the time from a defined sales starting point to a defined close. For the basic time-to-win measure in this guide, average sales cycle length is the mean number of calendar days taken by comparable opportunities that closed won during a selected period.
The arithmetic is simple. The useful work is deciding when the clock starts, which wins belong in the calculation and what counts as the final close. Two teams can report different results from the same process if they use different rules.
What is sales cycle length?
Sales cycle length measures elapsed time through the selling process. One business might start when a qualified opportunity is created and stop when a signed agreement is marked closed won. Another may start at first contact. There is no universal starting event: document yours and apply it consistently to every deal being compared.
A sales pipeline shows where active opportunities are now. Sales cycle length looks backward at completed deals and asks how long they took to reach the chosen outcome.
The formula
Average sales cycle length = Total days to close all included won deals / Number of included won deals
For each deal:
Days to close = Close date - Defined start date

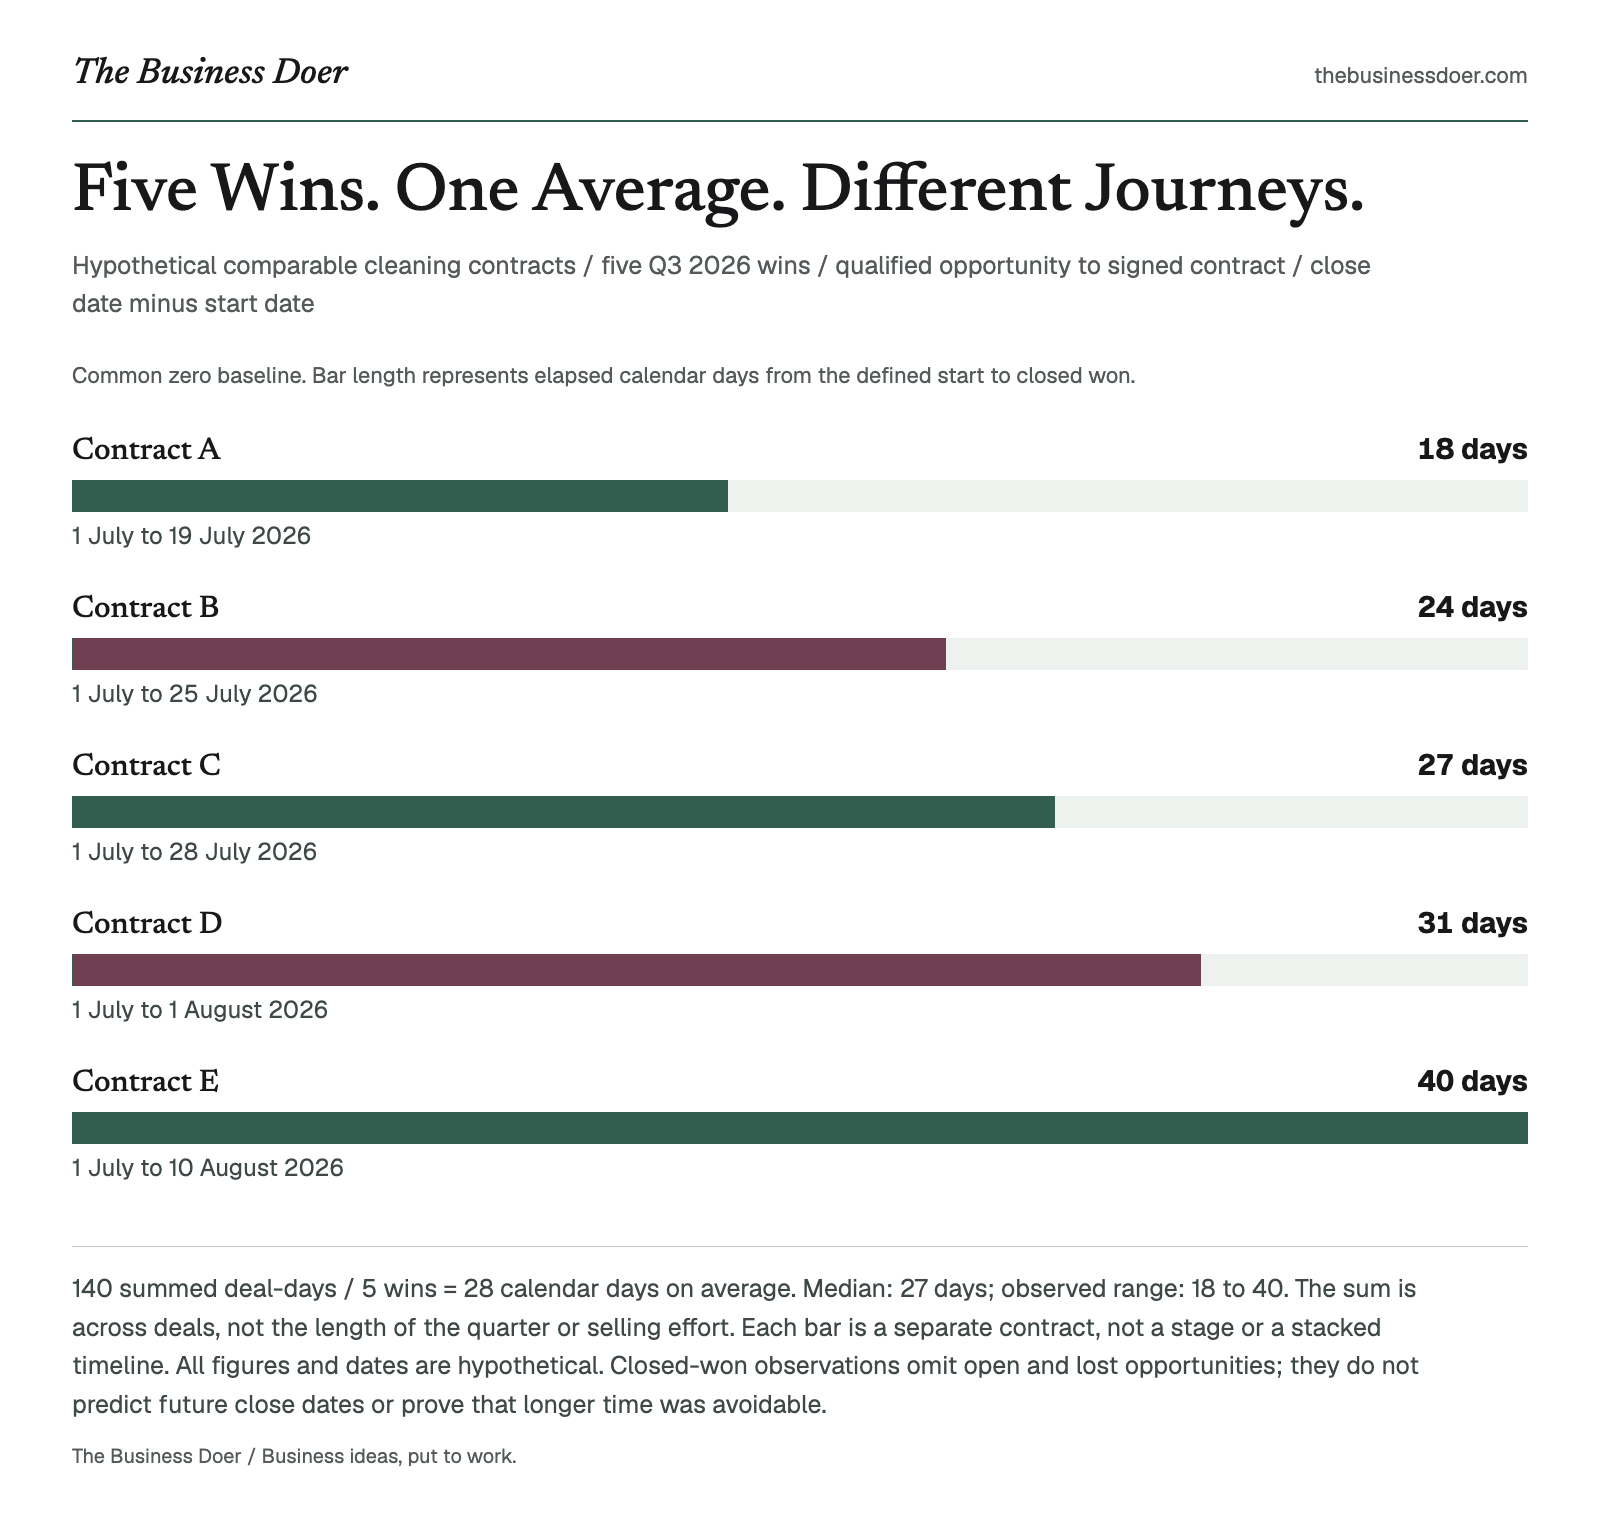
Visual reference. 140 summed deal-days / 5 wins = 28 calendar days on average. Median: 27 days; observed range: 18 to 40. The sum is across deals, not the length of the quarter or selling effort. Each bar is a separate contract, not a stage or a stacked timeline. All figures and dates are hypothetical. Closed-won observations omit open and lost opportunities; they do not predict future close dates or prove that longer time was avoidable.
Text version
Hypothetical comparable cleaning contracts / five Q3 2026 wins / qualified opportunity to signed contract / close date minus start date
- Contract A
- 18 days. 1 July to 19 July 2026
- Contract B
- 24 days. 1 July to 25 July 2026
- Contract C
- 27 days. 1 July to 28 July 2026
- Contract D
- 31 days. 1 July to 1 August 2026
- Contract E
- 40 days. 1 July to 10 August 2026
Define these rules before calculating:
- Start event: for example, qualified opportunity created.
- End event: for example, contract signed and marked closed won.
- Scope: one comparable group, such as new commercial cleaning contracts rather than a mixture of new contracts and renewals.
- Close window: include wins whose close dates fall within one completed month or quarter, including its first and last dates. This is a close-date window, not a window of opportunities created during that period. A qualifying start date can precede the window.
Subtract the dates without adding an inclusive extra day. A deal that starts and closes on the same date takes 0 days, which is valid. A missing start or close date is missing evidence, not a zero-day sale: resolve or explicitly exclude and record it before using the result. With no eligible wins, the average is undefined, not zero.
Use calendar days, including weekends and holidays. If your CRM supplies timestamps, first convert both timestamps to dates in the same documented business time zone. The difference between those dates is not a count of elapsed 24-hour blocks; daylight-saving changes do not turn a calendar day into a fraction. Do not silently substitute business days or mix time zones.
Count only closed-won deals for this time-to-win calculation. Open opportunities have not finished, and closed-lost opportunities answer a different question. Inspect their age or time to loss separately; do not enter them as zero. Record the source and any missing, excluded or unreliable records so the average's limits remain visible.
Why does it matter?
Sales cycle length gives a team a consistent way to review how long completed wins took. It can help identify unusually slow deals, compare similar groups over time and locate stages that deserve closer inspection.
A shorter cycle can reduce the time an opportunity remains open, but shorter does not automatically mean better. Larger or more complex agreements may reasonably require more evaluation, approvals and negotiation. The number alone does not establish stronger sales performance.
A simple example
Hypothetical example: A small commercial cleaning company reviews comparable new contracts closed won in Q3 2026, July 1 through September 30. It starts the clock when an opportunity is qualified and stops when the contract is signed and marked closed won. All dates and notes below are teaching inputs, not actual CRM records.

A pre-project site visit gives the one-time cleaning offer a concrete setting. This generated scene is illustrative, not a real customer meeting or evidence of deal values, win rates or faster closing.
| Won contract | Qualified start date | Closed-won date | Calendar days to close |
|---|---|---|---|
| Contract A | 2026-07-01 | 2026-07-19 | 18 |
| Contract B | 2026-07-01 | 2026-07-25 | 24 |
| Contract C | 2026-07-01 | 2026-07-28 | 27 |
| Contract D | 2026-07-01 | 2026-08-01 | 31 |
| Contract E | 2026-07-01 | 2026-08-10 | 40 |
| Total | 140 |
140 total deal-days / 5 won contracts = 28 days average sales cycle length
The median is 27 days and the range is 18 to 40 days. These provide context for the mean, which remains the primary measure here. The 140 days are the sum of five separate contract durations, not the calendar duration of the quarter. The contracts can be in progress at the same time.
All five start on July 1 only to make this example easy to follow. Sharing a start date is not an inclusion rule. A contract qualified before July would also belong if it met the same scope and closed won during Q3.
These five wins are not the whole group of opportunities entering the process. Some opportunities may still be open or may have been lost. Looking only at completed wins creates survivorship, or completed-case, bias: slow unfinished deals are absent, so this average cannot describe how long every entrant will take. Review open age and lost outcomes separately.
Suppose a recorded note for Contract E identifies 12 calendar days awaiting the customer's finance approval. This is an additional hypothetical detail, conditional on having that evidence. Approval may overlap other work, and some or all of it may be necessary. It does not establish 12 avoidable days, and subtracting 12 from the contract or the average would not demonstrate an improvement.
The next question might be: Can approval requirements be identified earlier, and what evidence would show that doing so changes the time to close? The metric has supplied a question to investigate, not a cause or a forecast.
When should you use it?
Use sales cycle length when your process includes identifiable opportunities that remain open for days, weeks or months. It is useful when reviewing discovery, proposals, approvals or negotiation, or comparing the same customer and product groups across periods.
Historical time to win can give timing assumptions in a sales forecast context. It does not predict an individual close date, guarantee future sales or establish when revenue or cash will be recorded. For immediate self-service purchases, tracking a separate opportunity cycle may add little value.
How to interpret the result
Compare like with like: the same team, product, customer type, start and end events, date convention and close-window rule. A change in deal mix can change the average even when the underlying process has not improved or deteriorated.
If the mean rises, inspect the deals behind it. Larger contracts, additional approvals, uncertain qualification or slow follow-up are possible questions to examine, not conclusions supplied by the metric. If it falls, check whether the team won smaller or simpler contracts before claiming progress.
Read the result alongside average deal size, deal count and the distribution of durations. A 20-day cycle for small standard contracts is not directly comparable with a 60-day cycle for large customized agreements. Neither number alone proves value, profit or causation.
Sort the durations and review the two slowest deals where available. The median and range help reveal whether one unusually slow win is pulling the mean upward. Five wins offer a small descriptive baseline, not a universal benchmark or reliable evidence of a trend.
Common confusion
Sales cycle length is not the sales cycle itself. The sales cycle is the sequence of selling steps; cycle length measures the time between the chosen start and end events.
Sales velocity combines opportunity volume, win rate, average deal value and cycle length into a directional pipeline measure. Cycle length is only its time component.
A verified same-day win can take zero calendar days. If every included win is same-day, the average is zero too; that is a valid descriptive result, but it cannot serve as the positive cycle-length divisor in the basic sales velocity formula.
Time in stage is narrower: it measures the time spent in a particular stage rather than the full start-to-close period. Separate stage intervals can overlap other activities, so a recorded wait is not automatically time that can be removed from the whole cycle.
Common mistakes
- Changing the starting point: first contact, lead creation and qualification can produce different results.
- Selecting by creation date: the basic measure here selects comparable wins by their close dates, even when their starts precede the period.
- Mixing outcomes: keep time to win, time to loss and the age of open opportunities separate.
- Turning missing dates into zeros: a verified same-day win is zero; an unknown date is not.
- Mixing calendars: convert timestamps consistently and do not replace calendar days with business days without changing the definition explicitly.
- Treating the mean as a deadline: it describes completed observations, not a promise for the next deal.
- Calling every reduction better: check deal mix, outcomes and recorded evidence first.
Limitations
Sales cycle length compresses different wins into one mean. It cannot explain a delay, establish customer fit, measure profitability or show whether enough opportunities were won. Poor CRM dates, changed stage definitions and incomplete records can make comparisons unreliable.
A close-window sample includes only wins completed during that period. Slow opportunities still open at the boundary and lost deals are outside this calculation. Inspect them separately before drawing conclusions about the whole process. Do not treat an average based on selected completed wins as the experience of every opportunity that entered.
Quick checklist
Put it to work
Calculate your first sales cycle length in 25 minutes
- Choose one completed month or quarter and one comparable group. Write the close-window dates.
- Define the start event, closed-won end event and calendar-day convention. Record the business time zone used to convert any source timestamps.
- List five to twenty closed-won deals with close dates inside that window. A smaller available group can still be described, but record its size as a limitation.
- Record an anonymous, distinct reference, start date and close date for each win. Resolve missing or invalid dates; document exclusions rather than filling gaps with zero.
- Subtract start date from close date for every included record, then add the durations and divide by the number of wins. Also note the median and range.
- Sort the list from fastest to slowest. Inspect the two slowest wins where available and record a stage or delay note only when evidence supports it.
- Record the source, limits, one observation and one question to investigate. Review the definitions and included records before relying on the result.
The worksheet accepts 1 to 20 closed-won records. Keep each reference anonymous and unique. Optional notes belong to the individual deals; the context belongs to the whole calculation. A reviewed TXT record carries the scope, rules, close window, source and limits, included records, notes, calculated results, observation and next question. Manual review records your judgment of the inputs; it does not independently verify CRM evidence.
Do not set a target by simply subtracting days from the average. First understand where the time went, whether activities overlapped and whether any delay was avoidable.
Closed-won deals only, selected by their close date. Starts may precede the window. Calendar days are close date minus start date; a same-day win is zero. Convert timestamps to dates in one consistent business timezone first.
1 / 20 records. One deal is mathematically sufficient; a small selected sample is not a population benchmark. Use anonymous references, not customer names.
No documented baseline yet. A valid close window, complete deal dates, evidence, interpretation and population review are required. Missing dates are not zero.
Review incomplete entries (11)
- Record valid first and last dates for the close window.
- Deal 1: Give this deal a unique anonymous reference.
- Deal 1: Record a valid start date (YYYY-MM-DD).
- Deal 1: Record a valid closed-won date (YYYY-MM-DD).
- Review the won-only population, matching start/end events, dates and completeness.
- Record the comparable deal group.
- Record the start event.
- Record the closed-won end event.
- Record the source, completeness and timezone limits.
- Record the supported observation.
- Record the next evidence question.
Key takeaways
- For basic time to win, average sales cycle length is total calendar days to close divided by the number of included wins.
- Define the start, end, comparable scope and close-date window consistently.
- Subtract dates without adding one; same-day zero is valid, but missing dates are not zero.
- Completed wins do not represent the whole entry cohort. Review slow open opportunities and lost outcomes separately.
- Use the mean, median, range and deal evidence to choose a question, not to promise a close date or declare that faster is better.
Final takeaway
Sales cycle length describes how long a defined group of completed wins took. Choose consistent events, select comparable wins by close date and calculate their calendar-day differences.
Then read the deals behind the average. The useful result is a documented baseline and a specific question about where time was spent and whether that time was necessary.