Sales Velocity: What It Is and How to Calculate It
Four inputs. One pace. No guaranteed sales.
On this page
Sales velocity combines the number of qualified sales opportunities, their average won value, the win rate and the time needed to close a sale. It expresses a pipeline's sales potential as a monetary amount per unit of time, usually per day.
The useful question is not simply "Are we closing faster?" It is "How do the amount, value, conversion and duration of our opportunities work together?"
What is sales velocity?
Sales velocity is a combined sales metric, often called pipeline velocity. Its four inputs connect the opportunities a team handles with the value it might win and the time that takes.
Treat the result as a directional planning measure, not money already earned or collected. Multiplying averages cannot establish when individual customers will sign or pay.

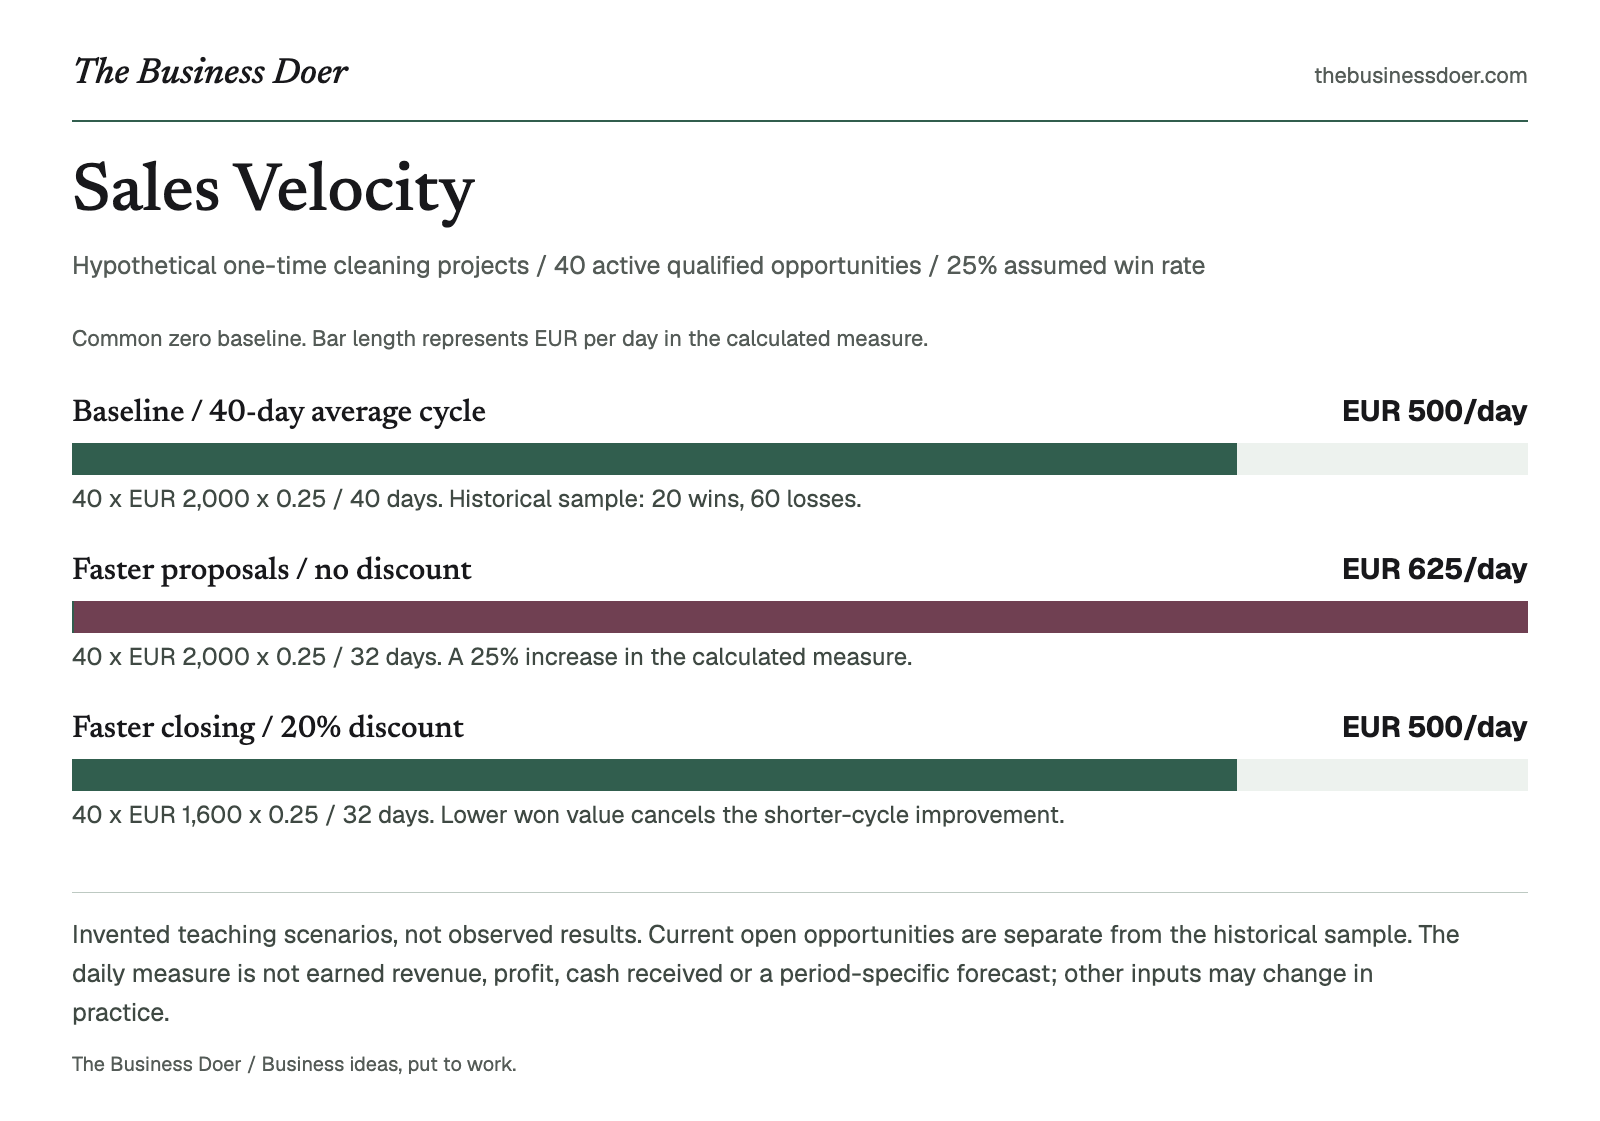
Visual reference. Invented teaching scenarios, not observed results. Current open opportunities are separate from the historical sample. The daily measure is not earned revenue, profit, cash received or a period-specific forecast; other inputs may change in practice.
Text version
Hypothetical one-time cleaning projects / 40 active qualified opportunities / 25% assumed win rate
- Baseline / 40-day average cycle
- EUR 500/day. 40 x EUR 2,000 x 0.25 / 40 days. Historical sample: 20 wins, 60 losses.
- Faster proposals / no discount
- EUR 625/day. 40 x EUR 2,000 x 0.25 / 32 days. A 25% increase in the calculated measure.
- Faster closing / 20% discount
- EUR 500/day. 40 x EUR 1,600 x 0.25 / 32 days. Lower won value cancels the shorter-cycle improvement.
Why does it matter?
Use it to compare your own pipeline over time, see which input changed, and examine a proposed improvement before acting. Reviewing the components helps distinguish too few qualified opportunities from weak conversion or slow progress.
A shorter sales cycle is not automatically an improvement if the price reduction used to achieve it cancels out the benefit.
The formula and its four inputs
Sales velocity = (Qualified opportunities x Average deal value x Win rate) / Average sales cycle length
Enter the win rate as a decimal in this formula: 25% becomes 0.25. When cycle length is in days, the result is expressed in currency per day. The worksheet below derives the baseline rate from wins and losses; its hypothetical scenario field explicitly accepts a percentage, not a decimal.
For this guide, use the following consistent measurement rules.
Qualified opportunities: Count active opportunities on the review date, not every contact or newsletter subscriber. Apply a documented entry rule, such as a confirmed customer need and a relevant offer. Your sales pipeline supplies this working list.
Average deal value: Use the final agreed value of comparable won deals, after discounts. Add their values and divide by the number of wins. Use one currency and value basis; do not mix monthly fees with whole-contract prices. The average deal size guide explains this input.
Win rate: For a defined historical period, divide won opportunities by all closed opportunities: won / (won + lost). Open deals are unresolved, not losses.
Average sales cycle length: For those historical wins, measure calendar days from qualification to the signed agreement, then average them. Other starting points are possible, but keep yours unchanged.
Use the same historical period and customer segment for the last three inputs. Record the current pipeline snapshot separately; it is not the historical closed-deal sample. Keep these definitions stable when comparing results.
A simple example
Hypothetical example: A commercial cleaning company sells one-time deep-cleaning projects. It wants to assess whether faster proposal handling could improve its sales pace. All figures below are invented for illustration.

A pre-project site visit gives the one-time cleaning offer a concrete setting. This generated scene is illustrative, not a real customer meeting or evidence of deal values, win rates or faster closing.
| Input | Evidence in the example | Value used |
|---|---|---|
| Qualified opportunities | Active projects on the review date | 40 |
| Average deal value | EUR 40,000 across 20 historical wins | EUR 2,000 |
| Win rate | The same historical period contains 20 wins and 60 losses | 25%, or 0.25 |
| Average cycle | Those 20 wins took 800 calendar days in total, from qualification to signature | 40 days |
The historical deals are comparable one-time projects, not the 40 currently open opportunities. The 800 days are the sum of the wins' individual elapsed durations, not the length of the historical reporting period; deals may overlap in time.
(40 x EUR 2,000 x 0.25) / 40 days = EUR 500 per day
The numerator represents EUR 20,000 of potential won value under the historical win-rate assumption. Dividing by the average cycle gives the EUR 500 daily measure. It does not mean EUR 500 arrives in the bank every day.
Now compare two hypothetical changes, keeping opportunities and win rate unchanged:
| Scenario | Average deal value | Cycle | Sales velocity |
|---|---|---|---|
| Current baseline | EUR 2,000 | 40 days | EUR 500/day |
| Faster proposal handling, no discount | EUR 2,000 | 32 days | EUR 625/day |
| Faster closing with a 20% discount | EUR 1,600 | 32 days | EUR 500/day |
The faster, undiscounted scenario raises the calculated measure by 25%. In the discounted scenario, the lower deal value removes that improvement. Neither scenario proves what customers will do. The next step is to test the proposal process and track price, wins and cycle time together.
When should you use it?
Use sales velocity when reviewing a pipeline that requires conversations, proposals or approvals. Start with one comparable customer group and enough completed sales to make the historical inputs informative. Do not blend very different deal sizes or buying processes.
How to interpret the result
Read the four inputs beside the headline number. A higher result may come from more opportunities, larger wins, better conversion or a shorter cycle; it does not identify the cause by itself.
Compare like with like. A larger team can produce higher total velocity without becoming more productive per person. Watch whether changes also affect discounts, selling costs or delivery capacity.
Common confusion
Sales cycle length measures time. Sales velocity combines time with opportunity volume, value and conversion.
A sales forecast estimates sales for a particular future period. Velocity alone does not account for the expected closing dates of individual deals. It is also neither profit nor cash flow: neither costs nor payment dates appear in the formula.
Common mistakes
- Counting unqualified contacts as opportunities while retaining a qualified-deal win rate.
- Entering 25 instead of 0.25 for a 25% win rate in the formula, or entering a decimal in a field labeled percent.
- Mixing customer segments, currencies, value bases or cycle definitions.
- Increasing one input on paper while ignoring its effect on the others.
- Treating the daily result as guaranteed sales or cash receipts.
Limitations
The measure compresses different deals into averages. It can mislead when open opportunities differ from the historical sample in age, stage or customer mix. It cannot prove demand, explain every delay or show profitability. Check the underlying deals before committing resources.
With no historical wins, average won value and average won cycle cannot be derived. A zero or unknown average cycle is not a usable denominator. Missing evidence should prompt data collection, not an invented daily result.
Quick checklist
Put it to work
Calculate and question one baseline in 20 minutes
Use an existing sales record or export; the time allowance assumes that the required records are available. If they are not, the output is a data-collection plan, not an invented result.
- Minutes 0-4: Define the scope. Select one offer or customer segment. Write the review date, qualification rule, currency, contract-value basis and cycle start/end events.
- Minutes 4-10: Record the inputs. Count active qualified opportunities. Choose a recent, comparable historical period and calculate average won value, won / (won + lost), and the average qualification-to-signature duration of wins. Record each source and the sample sizes.
- Minutes 10-13: Calculate. Multiply the first three inputs, using a decimal win rate, and divide by average days. Check that the cycle is positive and that the required historical samples exist.
- Minutes 13-17: Test a change on paper. Change one input; label it hypothetical. Identify another input that could move in response, such as lower deal value after offering a discount.
- Minutes 17-20: Decide what to investigate. Record one action, the evidence required and what would make the apparent improvement misleading.
Finish with: "Our baseline is ___ per day. We will test ___ and check ___ before treating a higher result as improvement."
No result yet. Record a valid current count and historical sample. No historical wins or a nonpositive cycle means the required averages cannot be derived; missing evidence is not zero.
- Record the current active qualified opportunity count, including zero.
- At least one historical win is needed to derive won value and cycle averages; zero wins cannot supply these inputs.
- Record historical closed losses, including zero; do not count open deals as losses.
- Record total agreed won value after discounts, including zero if appropriate.
- Record a positive sum of the historical wins' elapsed calendar days.
- Record the segment / offer.
- Record the snapshot date.
- Record the historical period.
- Record the qualification rule.
- Record the deal-value basis.
- Record the cycle start/end events.
- Record the next evidence-gathering action.
Key takeaways
- Sales velocity combines qualified opportunity count, average deal value, win rate and average cycle length.
- A consistent measurement definition is as important as the arithmetic.
- The result is a directional amount per day, not guaranteed revenue, profit or cash received.
- Improving one input may weaken another; a faster discounted sale need not improve velocity.
- Use the calculation to choose a test, then check the underlying deals and actual outcomes.
Final takeaway
Sales velocity connects four inputs in one calculation. Its value comes from understanding their interaction, not chasing a larger headline number. Keep definitions consistent, show the working and use the result to choose a specific next test.